A container capped at three quarters of a processor can slow down without anything looking abnormal, because its application tunes itself on information that does not concern it. At startup, it asks the system how many processors are available, sizes its threads on the answer, and gets the number of the machine, not the one of its limit. This is the case of an application that reads nproc; some runtimes (the Java virtual machine, for example) read the quota of the cgroup instead, the ceiling the kernel applies to a group of processes, and adapt to it.
Two other failures come from the same ground. A database limited to 768 MB, which reports 450 MB according to its own metrics, still gets killed now and then by the kernel. A service complains about file descriptors (the numbers the kernel assigns to the files and connections a process opens) on a machine that has plenty. This page teaches you to read and to set three settings that are easy to forget to look at, --cpus, --shm-size and --ulimit, and to understand why they do not belong to the same family.
What you will learn
- Read the CPU quota that a cgroup declares, and compare it with what the container sees
- Tell apart a time limit from a restriction of the processors
- Prove that a limit has bitten, with the throttling counter
- Measure two defaults: the size of
/dev/shmand the file descriptor limit - Set both at creation of a container
- Understand why
/dev/shmcounts against the container's memory
Prerequisites
An installed engine (installing Docker) on a Linux host using cgroups v2 (stat -fc %T /sys/fs/cgroup prints cgroup2fs), and root or sudo access to read /sys/fs/cgroup. Knowing what a cgroup is helps: Namespaces and cgroups: measure a container's isolation introduces it from Docker, and Understanding Linux cgroups goes into detail. The commands are written for Docker Engine 29.9.2 and the alpine:3.24 image. A neighboring lesson, the execution chain, shows which programs start the container on the host.
The container names and a few strings in this page are French, because the commands are the ones that were run: plafonne means "capped", restreint "restricted", partage "shared". They are identifiers, so they stay as they are.
Who limits what: the cgroup or the process?
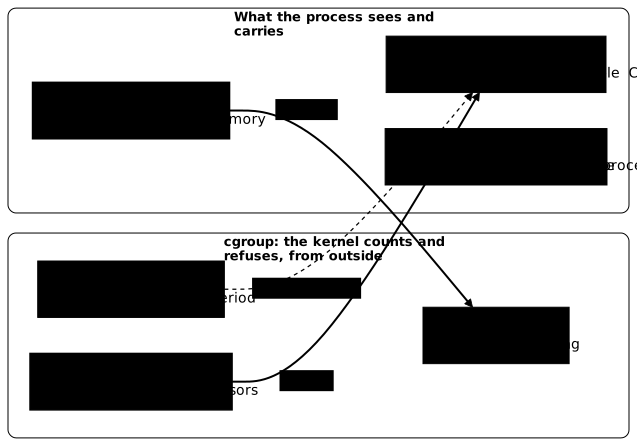
Two distinct mechanisms hide behind the limit options, and they are not read in the same place. A cgroup is a group of processes to which the kernel applies counters and ceilings: it is the kernel, outside the process, that measures the consumption of the container's group, then holds it back or kills it. Ulimits are older than cgroups: they are limits specific to each process, which it passes on to its children, and no cgroup is involved.
The diagram sorts the three settings of this page on either side of that border. Look in particular at the dashed arrow, which says that a CPU time limit does not change the number of processors the container sees.
For ulimits in general, outside containers, the guide Limiting a process's resources with ulimit and systemd is the reference. For cgroup limits set by hand on a container built without an engine, see Limit a container: cgroups v2 and capabilities.
What does the --cpus option really do?
It limits the processor time granted per slice, and hides no processor. To see it, we start a container capped at three quarters of a unit, and read what the cgroup declares, then what the container believes it has.
docker run -d --name plafonne --cpus 0.75 alpine:3.24@sha256:be2656061b536c1883c4034790e21d0a09c5aaaf51968b89368a3c0371ea2c9a sleep infinityID=$(docker container inspect plafonne --format '{{.Id}}')CG="/sys/fs/cgroup/system.slice/docker-$ID.scope"sudo cat "$CG/cpu.max"docker exec plafonne nprocnprocThe first reading gives the cgroup's quota, as two numbers: a granted time and the length of the slice, in microseconds. This path assumes the systemd cgroup driver, which places containers under system.slice; on a machine configured otherwise, the path differs.
75000 10000022The two 2 are the container's nproc then the host's: the --cpus option changed nothing about what the container counts.
The kernel cannot express "0.75 CPU": it counts a time per slice. And above all, the container always sees all the processors of the machine. An application that reads nproc to size its threads therefore starts far too many, and spends its time being held back. A time limit is not a restriction of the view.
How do you make the container see fewer processors?
With the other mechanism: pinning the container to a subset of CPUs. It then receives not less time but fewer processors, and this time it sees it. The following example pins the container to the single processor numbered 1 (processors are counted from 0): it only shows "fewer" on a machine with at least two CPUs, because on a single-processor machine the container already saw one.
docker run -d --name restreint --cpuset-cpus 1 alpine:3.24@sha256:be2656061b536c1883c4034790e21d0a09c5aaaf51968b89368a3c0371ea2c9a sleep infinitydocker exec restreint nprocID2=$(docker container inspect restreint --format '{{.Id}}')sudo cat "/sys/fs/cgroup/system.slice/docker-$ID2.scope/cpuset.cpus"11The output shows nproc equal to 1, then the list 1 read in cpuset.cpus. The table sums up the difference between the two options.
| Option set | What changes in the cgroup | Answer of nproc in the container |
|---|---|---|
--cpus 0.75 | cpu.max: 75 ms of processor time per slice of 100 ms | the number of CPUs of the machine |
--cpuset-cpus 1 | cpuset.cpus: only processor 1 is usable | 1 |
The two mechanisms can be combined, and they do not answer the same question: the first caps consumption, the second changes the answer the system gives to the application. If your application reads nproc to size itself, the time limit alone does not fix it; you have to configure it explicitly or use the second mechanism.
How do you prove that a CPU limit has bitten?
By reading the cgroup's throttling counter. A limit whose effect you have never observed remains a hypothesis. The cpu.stat file contains the nr_throttled line, the number of times the kernel had to hold the group back because it had used up its quota.
As long as the container does nothing, the counter stays at zero. So we put plafonne under load with three loops that never stop, wait a few seconds, then read again. The CG variable is the one from the first section: stay in the same terminal.
sudo grep -E 'nr_throttled|throttled_usec' "$CG/cpu.stat"docker exec -d plafonne sh -c 'while :; do :; done'docker exec -d plafonne sh -c 'while :; do :; done'docker exec -d plafonne sh -c 'while :; do :; done'sleep 5sudo grep -E 'nr_throttled|throttled_usec' "$CG/cpu.stat"docker stats --no-stream --format '{{.Name}} {{.CPUPerc}}' plafonnenr_throttled 0throttled_usec 0nr_throttled 51throttled_usec 6315695plafonne 73.64%Two observations go together. The percentage reported by the engine stays close to the ceiling (0.75 CPU corresponds to about 75%), which says the limit holds. The counter, for its part, says the kernel did hold the group back, which is the proof. The day an application is slow for no apparent reason, a rising nr_throttled is a clue to look at early.
Which defaults decide a container's fate?
Two, which are easy to forget to look at. The size of /dev/shm (a space of memory shared between the container's processes) can fall short for a database that uses it for its buffers. The file descriptor limit has been low since Docker 29: the engine's release notes state that containers now take systemd's default limit, well below the million descriptors they used to receive (Docker Engine 29 release notes). An application that opens many files or connections hits it quickly.
A limit set below the default caps the container, a limit set above it widens it: so you need to know the default of your engine before setting anything. Read it on a container started with no option at all: ulimit -n returns the soft limit (the one the process is subject to) and ulimit -Hn the hard limit (the ceiling it cannot exceed).
docker run --rm alpine:3.24@sha256:be2656061b536c1883c4034790e21d0a09c5aaaf51968b89368a3c0371ea2c9a sh -c 'ulimit -n; ulimit -Hn'The first line of the output is the soft limit, the second the hard limit. The default size of /dev/shm is read the same way, with df -m /dev/shm in a container with no option: note it down, it serves as the point of comparison for the next section. An old application, written for the time when the engine gave more than a million descriptors, can fail on an engine 29 without anything having changed in its image. To get a high limit back, you pass --ulimit at creation or set default-ulimits in /etc/docker/daemon.json (see the daemon configuration, in French).
How do you set /dev/shm and file descriptors at creation?
Both are set when the container is created and cannot be changed afterwards: you have to recreate the container to modify them. Here we ask for a 128 MB /dev/shm and a limit of 512 descriptors, soft and hard alike: this is a value different from the default you just noted, without which the measurement would not prove that the setting was applied, and it is below it, so it caps.
docker run -d --name partage --shm-size 128m --ulimit nofile=512:512 alpine:3.24@sha256:be2656061b536c1883c4034790e21d0a09c5aaaf51968b89368a3c0371ea2c9a sleep infinitydocker container inspect partage --format 'shm={{.HostConfig.ShmSize}}'docker exec partage df -m /dev/shmdocker exec partage sh -c 'ulimit -n; ulimit -Hn'shm=134217728Filesystem 1M-blocks Used Available Use% Mounted onshm 128 0 128 0% /dev/shm512512The two settings are not read in the same place, and that follows from their different natures. The size of the shared memory is a mount: the container inspection declares it (.HostConfig.ShmSize, in bytes) and the container sees it as a filesystem. The descriptor limit is a ulimit: it belongs to the process, so you read it where the process is subject to it, from inside the container. The --ulimit nofile=soft:hard syntax sets both bounds; with a single number, both take that value: on Engine 29.9.2, --ulimit nofile=2048 gives 2048 as the soft limit and 2048 as the hard limit.
Why does shared memory count against the container's memory?
Because /dev/shm is a tmpfs, a filesystem that lives in RAM, and that memory is counted in the container's cgroup. For the application, /dev/shm looks like a filesystem; for the kernel, it is the container's memory. The cgroup's memory.current file gives the memory currently in use, and you can watch the shared memory enter it. The echo strings below stay in French, as they were run: avant means before, après after, and Mo stands for MB.
IDE=$(docker container inspect partage --format '{{.Id}}')CGE="/sys/fs/cgroup/system.slice/docker-$IDE.scope"echo "avant : $(( $(sudo cat "$CGE/memory.current") / 1024 / 1024 )) Mo"docker exec partage dd if=/dev/zero of=/dev/shm/remplissage bs=1M count=96docker exec partage df -m /dev/shmecho "après : $(( $(sudo cat "$CGE/memory.current") / 1024 / 1024 )) Mo"avant : 0 Mo96+0 records in96+0 records out100663296 bytes (96.0MB) copied, 0.036112 seconds, 2.6GB/sFilesystem 1M-blocks Used Available Use% Mounted onshm 128 96 32 75% /dev/shmaprès : 96 MoWriting 96 MB into /dev/shm raises the container's memory from 0 to 96 MB. The consequence in production is direct: a memory limit (set with --memory) must account for the size of /dev/shm, otherwise the container gets killed while its application metrics stay under the limit. That is the database incident from the beginning: the buffers it writes into shared memory add to the 450 MB that its own metrics measure. To recognize a death by lack of memory (OOM, for out of memory), see the diagnosis in limit resources and restarts of a Compose stack.
How do you clean up after the measurements?
Three containers of this page hold a sleep infinity or a loop and keep their limits until you delete them. The -f option stops them before removing them.
docker rm -f plafonne restreint partageThe command prints the three names. The containers started with --rm removed themselves.
Practice
Two labs, in order. The first starts from a container already capped on CPU: you fill in the quota its cgroup declares, as is, and the number of CPUs it sees from the inside, you start a second container that sees fewer through the other mechanism, then you put the first one under load. The validation reads the cgroup again at grading time, compares your answers with what it declares, checks that the second container sees fewer CPUs than the machine, and requires nr_throttled to be greater than zero: the limit must have bitten.
In the second, no container is running: you measure the two defaults on a container with no option and record them, then you start a container whose statement fixes the name and the two settings, and you write data into its shared memory. The validation measures the defaults again on a new container, checks the two settings inside the container, then compares the occupation of /dev/shm with the cgroup's memory.
Key points
-
Cgroups are applied by the kernel, ulimits belong to the process: you do not look for them in the same place.
-
--cpus 0.75limits a time, not a view:cpu.maxis written as two numbers, and the container still sees all the CPUs of the machine. -
--cpuset-cpuschanges the answer ofnproc: it restricts the set of usable processors, which the time limit does not do. -
A limit is proven by
nr_throttled: as long as thiscpu.statcounter stays at zero, the limit has never bitten. -
/dev/shmand the descriptor limit are set at creation (--shm-size,--ulimit nofile=soft:hard) and are read in two different places. -
The descriptor limit is low by default since Docker 29: read your engine's before setting it, and an application that is hungry for files or connections must raise it with
--ulimitordefault-ulimits. -
/dev/shmis memory, counted in the cgroup: a memory limit must account for it, otherwise the container is killed while its application metrics stay under the limit.
Knowledge check
Check that you have the essentials of this guide. The questions cover only what has just been explained here.
Knowledge check
Check what you have learned with this interactive quiz
How it works
- The timer starts when you click Start
- Multiple choice, true/false and short answer questions
- You can move between questions
- Detailed results are shown at the end
Starts the quiz and the timer
Review
(0/0)Score by domain
A domain groups several guides and gets several questions, so its score is more reliable than a per-topic score, which often rests on a single question.
Summary
Strengths
No topic passed at 80% on at least two questions yet.
Weak areas
No topic below the pass mark.
Recommended next
Hints before you try again?
Continue the course: Cap memory and the number of tasks of a container
A new full quiz with random questions
Work again only on the questions you missed