A request crosses three services, takes half a second to answer, and no log says where the time went. This lesson is for someone who can already write and start a Compose stack: you learn to read the logs of the whole stack, to follow a request from end to end, then to name the saturated service with the kernel counters.
You will also see two traps: the service that writes the most logs is not the one that is saturated, and a badly set up log copies a secret into a file that stays readable long after the request. The lesson ends with the risk that logs pose to the disk: a json-file log grows without bound.
What you will learn
- Read the logs of a stack, order them with
--timestampsand filter them with--since,--tailand--no-log-prefix. - Reconstruct a request across several services with a shared identifier.
- Tell what each log says, or does not say, about where the time went.
- Recognize a log that copies a secret, and fix it.
- Attribute a saturation to a service with
cpu.max,cpu.statanddocker stats. - Measure the growth of an unbounded json-file log and understand the risk it poses to the disk.
Prerequisites
You need a Linux host with Docker Engine 29.9.2 and its Compose 5.6.1 plugin, installed from the official repository as the lesson on installing Docker shows. The Linux kernel counts and limits the resources of a container in a cgroup (a control group). The files read below (/sys/fs/cgroup/...) are those of cgroup v2, the version Debian 13 uses. Reading the log files on disk requires sudo. The curl and awk commands are used for the measurements.
You know how to write a stack with Compose, and you have seen the file variants in Development and deployment: explicit variants. The lesson Limit resources and restarts of a Compose stack introduced cpus, cpu.max and the nr_throttled counter; this lesson reuses them to find a culprit.
To understand how the kernel enforces a CPU quota, Cap a container: CPU, ulimits and shared memory explains it. Logs, metrics and traces in general are presented in Observability: logs, metrics and traces; here, we stay with what a Docker host offers without any extra tool.
Which stack serves as the demonstration?
A stack of three services, in a ~/guichet folder. The name: guichet field of the file sets the project name, whatever the name of the folder and without a -p option: docker compose ls lists the guichet project, and the containers are called guichet-.... The entree service receives requests on port 8090 of your machine. It passes them to annuaire, which passes them to calcul. The calcul service simulates CPU work: on each request, it computes the digest of 20 MB of zeros.
The names are French (guichet is a service counter, entree the entry point, annuaire a directory, calcul a computation), because the commands and outputs shown are the ones that were run. They are identifiers and program output, so they stay as they are.
Create the folder, then write the compose.yaml file in it.
mkdir -p ~/guichetcd ~/guichetname: guichetservices: entree: image: nginx:1.30.6-alpine@sha256:0e52bd054126cdc040b1276c0af347aeb02a41b9cfe305d6094767ac30e97949 ports: - "127.0.0.1:8090:80" volumes: - ./entree.conf:/etc/nginx/conf.d/default.conf:ro depends_on: - annuaire annuaire: image: nginx:1.30.6-alpine@sha256:0e52bd054126cdc040b1276c0af347aeb02a41b9cfe305d6094767ac30e97949 volumes: - ./annuaire.conf:/etc/nginx/conf.d/default.conf:ro depends_on: - calcul calcul: image: alpine:3.24@sha256:be2656061b536c1883c4034790e21d0a09c5aaaf51968b89368a3c0371ea2c9a command: ["nc", "-lk", "-p", "8080", "-e", "/srv/service.sh"] cpus: 0.5 volumes: - ./service.sh:/srv/service.sh:rocalcul is limited to half a CPU with cpus: 0.5. The other two services have no limit at all: this difference matters below. The calcul service listens with nc -lk -e, which launches the script on each connection.
The two nginx services write their access lines as JSON on standard output, with a request identifier: a unique string created when the request arrives, which every service copies so that it can be found everywhere. Here is entree.conf, which creates this identifier with the $request_id variable, returns it to the client in a response header and passes it to annuaire.
log_format jsonlog escape=json '{"service":"entree","t":"$time_iso8601","id":"$request_id","path":"$uri","status":$status,"duree":$request_time}';server { listen 80; access_log /dev/stdout jsonlog; add_header X-Request-ID $request_id always; location / { proxy_set_header X-Request-ID $request_id; proxy_pass http://annuaire:80; }}And annuaire.conf, which logs the identifier it received ($http_x_request_id), answers /ping itself, and forwards /calcul to the calculator.
log_format jsonlog escape=json '{"service":"annuaire","t":"$time_iso8601","id":"$http_x_request_id","path":"$uri","status":$status,"duree":$request_time}';server { listen 80; access_log /dev/stdout jsonlog; location = /ping { return 200 "ok\n"; } location /calcul { proxy_set_header X-Request-ID $http_x_request_id; proxy_pass http://calcul:8080/; }}Finally service.sh, the calculator. It reads the request headers, keeps X-Request-ID, writes one line at the start and one at the end of the computation on its error output (debut and fin mean start and end; duree in the JSON is the duration), then answers. Make it executable with chmod 755 service.sh, otherwise nc cannot launch it.
#!/bin/shid=inconnuwhile IFS= read -r l; do l=${l%?} [ -z "$l" ] && break case "$l" in [Xx]-[Rr]equest-[Ii][Dd]:*) id=${l#*: };; esacdoneecho "calcul id=$id debut" >&2r=$(head -c 20000000 /dev/zero | sha256sum)echo "calcul id=$id fin" >&2printf 'HTTP/1.0 200 OK\r\nContent-Type: text/plain\r\nConnection: close\r\n\r\n%s\n' "$r"Start the stack and send two requests: a computation, then a simple ping.
cd ~/guichetdocker compose up -dcurl -s -i http://127.0.0.1:8090/calculcurl -s -o /dev/null -w '%{http_code}\n' http://127.0.0.1:8090/pingLook at the X-Request-ID header of the first response: it is the identifier you will follow in the logs. A single computation takes between 0.2 and 0.3 s to answer, and the ping answers 200 right away. The reference machine of this lesson has 2 CPUs: your durations depend on yours.
How do you read the logs of the whole stack?
With docker compose logs, which gathers the logs of all the services of the project. Each line starts with the name of the service and its number, followed by a vertical bar. With no service named, you first get the nginx startup messages, then the access lines.
docker compose logsentree-1 | /docker-entrypoint.sh: Configuration complete; ready for start upentree-1 | 2026/11/02 21:06:22 [notice] 1#1: nginx/1.30.6entree-1 | {"service":"entree","t":"2026-11-02T21:06:25+00:00","id":"ba1b658820b112427826a40b76362fbd","path":"/calcul","status":200,"duree":0.227}entree-1 | {"service":"entree","t":"2026-11-02T21:06:25+00:00","id":"5b686531951b2d9905c8eae607c2d2fd","path":"/ping","status":200,"duree":0.000}This excerpt keeps only four lines of entree. Look at the entree-1 | prefix: it tells you which container wrote the line. Look also at the two JSON lines, the /calcul request (0.227 s) and the /ping (0.000 s): the duree field is the total duration seen by this service. It is an application measurement, written by nginx, as opposed to the kernel counters read further down.
Why does the order of the lines change from one call to the next?
Because, without the -f option, docker compose logs displays the lines grouped by service, and the order of the groups is not stable. From one docker compose logs --tail 4 call to the next, the services scroll by in an order that changes, for example entree, annuaire, calcul, then calcul, entree, annuaire. The result is therefore not a timeline: two lines from different services, one under the other, are not in the order in which they arrived.
To restore time, add --timestamps. Docker then puts in front of each line the time at which it received the message, in UTC and to the nanosecond.
docker compose logs --timestamps --tail 2 calculThe calcul lines carry no date in their message: this option is what lets you place them in time. With the dates in front, you can put the lines of several services back in order yourself. In follow mode (-f), the lines arrive instead in the order in which they are written, interleaved between the services.
How do you keep only the useful lines?
With four options, which combine. The table summarizes them, then an example shows them at work.
| Option | What it does | Good to know |
|---|---|---|
--since 5s | Shows only the lines of the last 5 seconds | Also accepts a date such as 2026-11-02T20:39:22Z or a Unix timestamp |
--tail 2 | Shows only the last 2 lines of each service | --tail applies service by service, not to the total |
-f | Follows the logs continuously | First replays the whole history, except with --tail 0 |
--no-log-prefix | Removes `entree-1 | ` in front of each line |
--since refuses a date written with a space between the day and the time: keep the T. You can also name the services to read: docker compose logs --tail 2 calcul entree shows only those two. To watch what arrives during four seconds, without the history, bound the follow with timeout.
timeout 4 docker compose logs -f --tail 0During those four seconds, send a ping from another terminal: you see the line from annuaire then the one from entree, and nothing else. The command ends with code 124, the one timeout returns: this is normal, it is timeout that stopped it.
--no-log-prefix is handy for passing the lines to a tool such as grep, provided that each line says by itself who wrote it. Here, the JSON lines carry the service field; those of calcul do not.
How do you reconstruct a request across the services?
By giving it an identifier that every service copies into its log, then searching for that identifier everywhere. That is the role of X-Request-ID in the setup: entree creates it, returns it to the client, and passes it to annuaire, which passes it to calcul.
The diagram follows a /calcul request and marks the moments when each service writes to its log. Notice that entree and annuaire write only when the response comes back, whereas calcul writes at the start and at the end of its work.
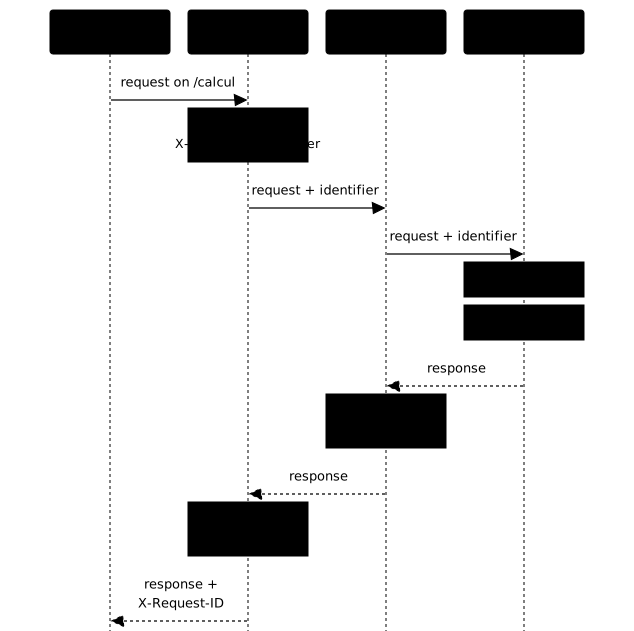
Send a request, get the identifier from the response header, then search for it in all the logs, with their dates.
ID=$(curl -s -D - -o /dev/null http://127.0.0.1:8090/calcul | tr -d '\r' | awk -F': ' 'tolower($1)=="x-request-id"{print $2}')docker compose logs --timestamps | grep "$ID"entree-1 | 2026-11-02T21:06:25.921365686Z {"service":"entree","t":"2026-11-02T21:06:25+00:00","id":"a7dd1f757575d4d7ed1f5523b234ec4e","path":"/calcul","status":200,"duree":0.279}calcul-1 | 2026-11-02T21:06:25.643240040Z calcul id=a7dd1f757575d4d7ed1f5523b234ec4e debutcalcul-1 | 2026-11-02T21:06:25.921101617Z calcul id=a7dd1f757575d4d7ed1f5523b234ec4e finannuaire-1 | 2026-11-02T21:06:25.921185845Z {"service":"annuaire","t":"2026-11-02T21:06:25+00:00","id":"a7dd1f757575d4d7ed1f5523b234ec4e","path":"/calcul","status":200,"duree":0.279}Look first at the fact that the same identifier appears in the three services: the request is reconstructed. Then look at the dates. entree and annuaire write their line at the end of the request, less than half a millisecond apart, and with the same duree, 0.279 s. With a format that notes only the total duration ($request_time), this duration says the request was slow, but not where: equal durations only place the time in annuaire or further down. nginx can separate the time spent upstream with the $upstream_response_time variable, which this format does not write.
Only the two calcul lines place the time: the computation started at second 25.64 of minute 21:06 and ended at second 25.92, so the 0.28 s were spent in calcul. These start and end lines are, like duree, application measurements written by the services themselves, unlike the kernel counters.
The table summarizes what each log provides.
| Log | Written when | What it says about time |
|---|---|---|
entree | At the end of the request | The total duration as seen by the client |
annuaire | At the end of the request | The duration seen from annuaire, that is, the work of calcul and the trip to it; the duration of entree adds the trip from entree to annuaire |
calcul | At the start and at the end of the work | The duration of the computation itself |
An access log that notes only the total duration of an intermediate service therefore does not locate a slowdown: it repeats it. With this format, to know where the time goes, at least one service must log the start and the end of its work with the identifier. An identifier that nobody wrote returns nothing: grep -c answers 0.
How do you keep a secret from ending up in the logs?
By never logging the headers or the bodies that contain one, and by checking it. A log is a copy: everything you write in it is kept on the host's disk, read by docker compose logs and picked up by every tool that collects logs.
Check with a marker value, a fake secret that is easy to find. Send a request with an Authorization header, then count the occurrences in the Compose output and in the log file of each container. The marker is passed as an argument of the command because its value is fake: a real secret is never typed into a command, it is read from a file, as the lesson Inject secrets, and know their limits lays out.
T=TEMOIN-bearer-s3cr3t-42curl -s -o /dev/null -H "Authorization: Bearer $T" http://127.0.0.1:8090/pingdocker compose logs | grep -c "$T"for c in $(docker compose ps -q); do sudo grep -c "$T" /var/lib/docker/containers/$c/$c-json.log; done0000With the log format of the demonstration, which contains neither the header nor its content, the value appears nowhere: a zero for the Compose output, then a zero for each of the three files. The header did cross the stack, though, because proxy_pass forwards it to annuaire; nobody simply wrote it down.
What happens if a log copies the header?
The secret is kept. To see it, start a variant that adds "auth":"$http_authorization" to the format of entree. Create entree-fuite.conf, a copy of entree.conf where only the log_format line changes (fuite means leak).
log_format jsonlog escape=json '{"service":"entree","t":"$time_iso8601","id":"$request_id","path":"$uri","status":$status,"auth":"$http_authorization","duree":$request_time}';Then create compose.fuite.yaml, which mounts this file in place of the first one.
services: entree: volumes: - ./entree-fuite.conf:/etc/nginx/conf.d/default.conf:rodocker compose -f compose.yaml -f compose.fuite.yaml up -dcurl -s -o /dev/null -H "Authorization: Bearer $T" http://127.0.0.1:8090/pingdocker compose logs entree | grep "$T"c=$(docker compose ps -q entree)sudo grep "$T" /var/lib/docker/containers/$c/$c-json.logentree-1 | {"service":"entree","t":"2026-11-02T21:06:28+00:00","id":"c276b07a1b26330b2c15f1825b080c46","path":"/ping","status":200,"auth":"Bearer TEMOIN-bearer-s3cr3t-42","duree":0.000}{"log":"{\"service\":\"entree\",\"t\":\"2026-11-02T21:06:28+00:00\",\"id\":\"c276b07a1b26330b2c15f1825b080c46\",\"path\":\"/ping\",\"status\":200,\"auth\":\"Bearer TEMOIN-bearer-s3cr3t-42\",\"duree\":0.000}\n","stream":"stdout","time":"2026-11-02T21:06:28.92724702Z"}Look at the "auth" field: the secret is in clear text in the docker compose logs line, and the same line is copied as is into the ...-json.log file, with Docker's JSON envelope on top.
The file belongs to root and is readable only by it (-rw-r-----), but the output of docker compose logs is readable by any account in the docker group, that is, by any account allowed to talk to the daemon. An account without that access gets nothing: docker compose logs fails with permission denied while trying to connect to the docker API, and reading the file directly is refused. Any collector that reads these logs sees the secret too, and, for the file, the leak lasts as long as the container: it leaves with it. The copies taken by collectors outlive it.
The fix removes the field from the format, then recreates the container. In the demonstration, docker compose up -d is enough because the compose.fuite.yaml override disappears from the list of files: the container's configuration changes, and Compose recreates it. If you only fix the mounted .conf file, the container's configuration does not change and docker compose up -d does not recreate it; you then need docker compose up -d --force-recreate entree, and then to recount the marker in the logs to prove the repair. Then consider the secret compromised and renew it: erasing it from the file does not tell you who has already read it.
Docker records the logs of a container with a logging driver, which decides where and in what form they are written. To find the driver and the file of a container, read them in docker inspect.
docker inspect -f '{{.LogPath}} {{.HostConfig.LogConfig.Type}}' $(docker compose ps -q entree)/var/lib/docker/containers/<identifiant>/<identifiant>-json.log json-fileThe output gives the path of the file followed by the driver, json-file, the default driver: one JSON file per container, in /var/lib/docker/containers/. As long as no /etc/docker/daemon.json file changes this setting, all your containers use it.
How do you tell which service is saturated?
By comparing what each service consumes with what it is allowed to consume. A service is CPU-saturated when it reaches its CPU ceiling and the requests wait behind it. The log does not say so: you have to read the kernel counters.
Two files in the container's cgroup are enough: cpu.max holds the quota, cpu.stat holds the counters.
With the default period, 100 ms, a service that has a quota can use only a share of each period; if it uses it up, the kernel suspends its processes until the next period. The period is then said to be throttled. The useful fields of cpu.stat are the following.
usage_usec: the CPU time consumed, in microseconds;nr_periods: the number of active periods under quota, that is, where the service had work;nr_throttled: the number of periods in which the service was throttled;throttled_usec: the total time spent waiting.
These counters only grow: read them before and after a load, then compare the differences.
How do you read the counters before and after a load?
With a small loop that reads the two files in each service. The -T option of exec avoids allocating a pseudo-terminal: it is the form to use in a script, where the output goes into a variable and not to the screen.
for s in entree annuaire calcul; do echo "[$s] cpu.max: $(docker compose exec -T "$s" cat /sys/fs/cgroup/cpu.max)" docker compose exec -T "$s" cat /sys/fs/cgroup/cpu.stat | grep -E '^(usage_usec|nr_periods|nr_throttled|throttled_usec) ' | tr '\n' ' '; echodone[entree] cpu.max: max 100000usage_usec 70104 nr_periods 0 nr_throttled 0 throttled_usec 0[annuaire] cpu.max: max 100000usage_usec 75324 nr_periods 0 nr_throttled 0 throttled_usec 0[calcul] cpu.max: 50000 100000usage_usec 473451 nr_periods 15 nr_throttled 8 throttled_usec 647419Look at cpu.max. The 50000 100000 value of calcul means "50 ms of CPU per 100 ms period", which is the half CPU requested by cpus: 0.5. The max 100000 value of the other two means "no limit".
Look also at nr_periods: it stays at 0 for entree and annuaire, because the kernel counts periods only if there is a quota. Without a quota, nr_throttled is 0 by construction, and this 0 does not prove that the service is not loaded: it only proves that it has no ceiling.
Note these values, then start a bounded load: 12 computations, three at a time, at the same time as 300 pings. The client records the code and the duration of each computation.
( seq 12 | xargs -P3 -I{} curl -s -o /dev/null -w '%{http_code} %{time_total}\n' http://127.0.0.1:8090/calcul > /tmp/calcul.out ) &( seq 300 | xargs -P4 -I{} curl -s -o /dev/null -w '%{http_code}\n' http://127.0.0.1:8090/ping > /tmp/ping.out ) &waitsort /tmp/calcul.out | awk '{n++; s+=$2; if($2>m)m=$2} END{print n" req, moyenne "s/n" s, max "m" s"}'12 req, moyenne 0.793539 s, max 1.017968 sAll 300 pings answered 200. Look at the duration: a single computation took about 0.25 s, and it now takes 0.8 s on average (moyenne is the average). Something is waiting: what remains is to find who. Read the counters again with the same loop, then subtract the earlier values.
| Service | Increase in usage_usec | Increase in nr_periods | Increase in nr_throttled | Increase in throttled_usec |
|---|---|---|---|---|
entree | 99,177 | 0 | 0 | 0 |
annuaire | 65,090 | 0 | 0 | 0 |
calcul | 1,718,101 | 37 | 33 | 3,508,743 |
Look at the calcul row. It consumed 1.72 s of CPU where the other two consumed less than 0.1 s. Above all, 33 of its 37 periods were throttled (about 89%). The kernel counted 3.5 s of throttling (throttled_usec) for a load that lasted 3.3 s: this total can exceed the real duration, because the kernel adds up the throttling durations of each run queue of the group, one per processor, and the measuring machine has two. The counters of the three services were read under the same conditions: only calcul has a ceiling, and it hits it. It is the saturated component.
Why is docker stats not enough?
Because it gives a snapshot, without saying whether the displayed percentage is a ceiling. Run in the middle of the load (here about one second after its start), it shows this.
docker stats --no-stream $(docker compose ps -q)CONTAINER ID NAME CPU % MEM USAGE / LIMIT MEM % NET I/O BLOCK I/O PIDS070354b9f32e guichet-annuaire-1 0.11% 3.43MiB / 2.84GiB 0.12% 176kB / 145kB 0B / 4.1kB 3fce8a928de17 guichet-calcul-1 50.58% 1.762MiB / 2.84GiB 0.06% 10.3kB / 7.42kB 0B / 0B 9a486c3347bbf guichet-entree-1 1.46% 3.531MiB / 2.84GiB 0.12% 289kB / 315kB 0B / 4.1kB 3Look at the CPU % column: 100% represents one whole core, so calcul at 50.58% is at its half CPU, while the other two stay under 2%. But docker stats does not tell you that 50% is a ceiling: without cpu.max and nr_throttled, this percentage could be that of a quiet service.
Two other columns should be read with care. The memory limit 2.84GiB is the memory of the machine, because no memory limit was set on the service. The NET I/O and BLOCK I/O columns are cumulative since startup. A reading taken once the load is over falls back toward 0%: the snapshot keeps nothing.
docker compose stats --no-stream also exists with Compose 5.6.1: with no argument, it returns the same columns for the containers of the project only, in an order that may differ.
What do docker compose ps and docker compose top say?
docker compose ps says nothing about the load. During the load, it shows for each service its image, its command, its age and its state, and all three are Up. It confirms that everything is alive, not that something is slow.
docker compose top goes further: it lists the processes of each service. Run during the load, it shows in calcul three active copies of service.sh (one per computation in progress), each with its head and sha256sum processes, and in entree and annuaire only the nginx processes. Run without load, it shows in calcul only the nc process.
docker compose topLook at the calcul lines: they show who consumes in the service, here the digest computation, which the PIDS column of docker stats confirms (9 processes in the excerpt above, against 1 without load; this number varies from one reading to the next). The C column of top is the instantaneous CPU percentage of each process, with no notion of a ceiling, and the TIME column stays at 00:00:00 for processes this short. top therefore helps find the faulty process inside a service that is already identified, not to identify the service.
Why is the service that writes the most logs not the saturated one?
Because a chatty service is a service that receives many requests, not a service that struggles to process them. During the same load, the lines written and the growth of the log file of each service were as follows.
| Service | Lines written | Growth of the json-file file |
|---|---|---|
entree | 312 | from 2,968 to 73,154 bytes (about 70 KB more) |
annuaire | 312 | from 2,975 to 73,788 bytes (about 71 KB more) |
calcul | 24 | from 708 to 3,537 bytes (about 2.8 KB more) |
The lines come from docker compose logs --no-log-prefix --since "$debut" <service> | wc -l, with debut=$(date -u +%Y-%m-%dT%H:%M:%SZ) taken just before the load. The sizes come from sudo stat -c %s on the file designated by LogPath. Look at the ratio: entree and annuaire wrote thirteen times more lines than calcul, and about twenty-five times more bytes, although they are the ones that are not saturated. The saturated component here is the quietest. Attributing a saturation to the biggest log points at the wrong service; only the CPU counters tell them apart.
Why can a json-file log fill the disk?
Because the json-file driver has, by default, no size bound: the file of a container grows as long as the container exists. To measure it, send 3,000 ping requests to entree and look at the file and the number of readable lines.
seq 3000 | xargs -P8 -I{} curl -s -o /dev/null http://127.0.0.1:8090/pingsudo stat -c %s "$(docker inspect -f '{{.LogPath}}' "$(docker compose ps -q entree)")"docker compose logs entree | wc -lThe file went from 73,154 to 747,805 bytes, and docker compose logs entree returns 3,331 lines: none is lost, but the file has no bound.
These 3,000 requests added about 675 KB. A service that receives requests continuously thus writes endlessly into /var/lib/docker/containers/, until it fills the host's disk. A full disk can hinder the other containers, which write to the same disk, not only the one that logs. Bounding these files is the subject of another lesson of the course.
What should you do when reading the logs gives nothing useful?
The table starts from what you observe, gives the probable cause, then what you do.
| What you observe | Probable cause | What you do |
|---|---|---|
annuaire exits at once with [emerg] host not found in upstream "calcul", then entree answers 502 | nginx resolves the name of its upstream service at startup; calcul did not exist yet or was down | Read docker compose logs annuaire, restart calcul first, then annuaire |
docker compose logs mixes the services in an order that changes | Without -f, the lines are grouped by service | Add --timestamps and read the dates |
The calcul lines have no date | The message does not contain one | Add --timestamps |
After --no-log-prefix, impossible to know who wrote | The prefix is removed | Put the service name in the message, like the service field of the JSON |
The duration is the same in entree and annuaire | Both write at the end of the request | Read the start and the end in the log of the service that does the work |
nr_throttled is 0 on a loaded service | This service has no quota, nr_periods stays at 0 | Read cpu.max first; without a quota, usage_usec shows what the service consumes, not what it waits for |
docker stats shows a huge memory limit | It is the memory of the machine, no limit is set | Set mem_limit if you want a ceiling |
A script stops after a docker compose exec | exec reads the standard input of the script, with or without -T | Add < /dev/null to the exec command |
A change to service.sh has no effect | An editor that replaces the file changes its identity, the container keeps the old mounted content | Recreate the container with docker compose up -d --force-recreate calcul |
How do you clean everything up after the demonstration?
The demonstration leaves three containers, a network, two images and the ~/guichet folder. The docker compose down command removes the containers and the network, and -v the volumes. The log files leave with the containers.
cd ~/guichetdocker compose down -v --remove-orphansdocker rmi nginx:1.30.6-alpine@sha256:0e52bd054126cdc040b1276c0af347aeb02a41b9cfe305d6094767ac30e97949cd ~ && rm -r guichetrm -f /tmp/calcul.out /tmp/ping.outAfter this, docker ps -a no longer shows any guichet-... container. Keep the Alpine image if you use it elsewhere, otherwise remove it in the same way.
Practice
The lab gives you a quote API that pairs a gateway and a calculator, with a computation load to support. You configure the stack with Compose, without writing any application code: you keep the identifier of each request in the logs of both components, you set hard CPU quotas, you measure a bounded load and you name the saturated component from the cgroup counters, not from the biggest log. You also keep the logs from containing the authorization header or a secret marker.
The validation reads the state of the stack rather than your commands: fresh identifiers present end to end in the traces and the response, effective quotas read in the cgroups, throttling counters that increase on the right component, absence of the secret in the logs, and refusal of a variant whose logs remain too chatty. It also requires that the stack be recreated from your Compose declaration.
Key points
docker compose logsgroups the lines by service, in an order that changes: without--timestamps, it is not a timeline.--sincefilters by duration or date,--tailapplies to each service,--no-log-prefixremoves the service name, so the line must say by itself who wrote it.- A request identifier copied in every service lets you follow it with a simple
grep. - An access log that notes only the total duration (
$request_time) repeats that duration from one service to the next.$upstream_response_timeseparates the time spent upstream, and the log of the service that does the work, with start and end, places the time. - Never log an authorization header: the secret is copied into the Compose output and into the container's json-file file. If it has leaked, renew it, and recreate the container so that the fix applies.
- A CPU saturation is proven with
cpu.max(the ceiling), then the increase innr_periods,nr_throttledandthrottled_usecincpu.statbefore and after a load. A service without a quota always hasnr_throttledat 0. docker statsis a snapshot,docker compose pssays nothing about the load,docker compose topshows which processes consume in a service that is already identified.- The service that writes the most logs is not necessarily the one that is saturated.
- Without a bound, the json-file log of a container grows as long as the container exists, and can fill the host's disk.
Knowledge check
Check that the essentials of this lesson have stuck. The questions cover only what has just been explained here.
Knowledge check
Check what you have learned with this interactive quiz
How it works
- The timer starts when you click Start
- Multiple choice, true/false and short answer questions
- You can move between questions
- Detailed results are shown at the end
Starts the quiz and the timer
Review
(0/0)Score by domain
A domain groups several guides and gets several questions, so its score is more reliable than a per-topic score, which often rests on a single question.
Summary
Strengths
No topic passed at 80% on at least two questions yet.
Weak areas
No topic below the pass mark.
Recommended next
Hints before you try again?
Continue the course: Back up and restore an application
A new full quiz with random questions
Work again only on the questions you missed