Kubernetes audit logs record every request to the API server for traceability and security investigation. They answer the questions "who did what, when, and through which method". This guide shows you how to configure an audit policy, enable the logs on the API server, and analyse the events with jq to detect suspicious behaviour or reconstruct an incident.
Configuring audit belongs to the Monitoring, Logging and Runtime Security domain of the CKS certification. Two gestures are expected there, and they are exactly the two this guide walks through: writing an audit policy, then configuring the API server to apply it. Everything stated here was replayed on a kind cluster running Kubernetes 1.37.
What you will learn
- Write an audit policy that keeps the evidence without copying the Secrets
- Enable audit on the API server of a kubeadm cluster, without breaking it
- Measure the effect of a
Nonerule on the volume of the log - Read an event and run an investigation with
jq - Find the audit logs on EKS, GKE and AKS
- Prove without help the hardening of the control plane with the module challenge, graded on the state of the cluster
Prerequisites
- Root access (or
sudo) over SSH on every control plane node: the policy and the API server manifest are files of the node, not objects of the cluster - A kubeadm or kind cluster, and
kubectlconfigured; on a managed cluster (EKS, GKE, AKS), access to the cloud console replaces access to the nodes jqon the analysis workstation: the log is one JSON object per line- Understanding of Kubernetes resources (pods, secrets, configmaps)
How does Kubernetes audit work?
Kubernetes audit records who did what, when and on which resource, at the
level of the API server. It is the only place in the cluster that sees
every request go by, since everything goes through it: kubectl,
controllers, operators, kubelets. Without audit, a Secret deletion or a
privilege escalation leaves no usable trace.
Two characteristics determine how to configure it. Audit is disabled by default, so you must enable it explicitly on the API server, which requires access to it and rules out most managed clusters. And it is verbose: an active cluster generates thousands of events per minute, which is why the policy that filters what is actually kept matters.
Audit has three parts:
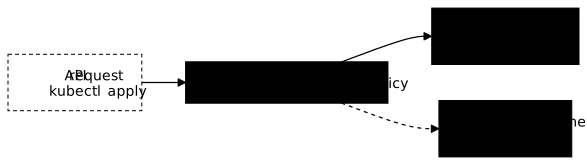
- Audit Policy: defines which events to capture and at what level of detail
- API Server: applies the policy and generates the events
- Backend: stores the logs (local file or webhook to an external system)
Set up a test cluster with audit enabled
Enabling audit requires modifying the API server manifest, which assumes a cluster of your own and some confidence. There is a shortcut: kind can set these flags at creation, and the resulting cluster is a real kubeadm cluster. Everything below can be checked on it, on the node image of the course, pinned by digest.
kind: ClusterapiVersion: kind.x-k8s.io/v1alpha4nodes: - role: control-plane image: kindest/node:v1.37.0@sha256:a1ed56cfb0e7b93589bdf97c8cd566405a265939e3620fc4f5de89adff580ae5 kubeadmConfigPatches: - | kind: ClusterConfiguration apiServer: extraArgs: audit-policy-file: /etc/kubernetes/audit/audit-policy.yaml audit-log-path: /var/log/kubernetes/audit/audit.log audit-log-maxage: "30" audit-log-maxbackup: "10" audit-log-maxsize: "100" extraVolumes: - name: audit-policy hostPath: /etc/kubernetes/audit mountPath: /etc/kubernetes/audit readOnly: true pathType: DirectoryOrCreate - name: audit-log hostPath: /var/log/kubernetes/audit mountPath: /var/log/kubernetes/audit readOnly: false pathType: DirectoryOrCreate extraMounts: - hostPath: /path/to/your/audit-folder containerPath: /etc/kubernetes/audit readOnly: trueextraMounts carries the folder that contains your audit-policy.yaml from
your workstation to the node, and extraVolumes makes it visible to the API
server container. Both are needed: without the first, the file does not exist
on the node; without the second, the API server cannot see it.
kind create cluster --name audit-lab --config kind-audit.yamlWhat audit actually writes
An event is one line of JSON. Here are the fields that matter, taken from
an event for the creation of a namespace by kubectl, under a rule at the
Metadata level:
level Metadataverb createuser kubernetes-adminobjectRef namespaces/audit-demoresponseStatus 201stage ResponseCompleteSix fields answer the six questions of an investigation: who, what, on what, with what result, at which moment of processing, and with what level of detail.
The difference between Metadata and RequestResponse, verified
This is the most important claim of this page, and it is proven by two
manipulations on the same cluster, with the reference policy given
further down: Secrets are at Metadata, RBAC objects at
RequestResponse.
A Secret created under a rule at Metadata:
| Field | Value |
|---|---|
level | Metadata |
requestObject | absent |
responseObject | absent |
| Does the value of the secret appear? | no, neither in plain text nor in base64 |
A Role created under a rule at RequestResponse:
| Field | Value |
|---|---|
level | RequestResponse |
requestObject | present |
responseObject | present |
| Readable content | yes, down to the rules of the Role (get, list on pods) |
In other words, RequestResponse writes the full body of the objects into
the log. Applied to Secrets, it drops their values in it: checked on this
cluster with an opposite rule, a Secret created with password=S3cr3t-2026
appears in requestObject and responseObject as
"password":"UzNjcjN0LTIwMjY=", that is the value in base64, readable by
anyone who opens the file. The audit log would become the weakest link of your
security. This is the reason for the rule that places Secrets at
Metadata before any broader rule.
Volume is not a detail
The same cluster at rest, one node, no deployment, was measured for
60 seconds with two policies: the reference policy of this
page, then the same one without its None rule on health probes.
without the None rule: 172 events, 154 KB, of which 66 probes (/readyz 60, /livez 6)with the None rule: 105 events, 108 KB, of which 0 probesProbes account for 38% of the events of a cluster that does nothing,
and the rest comes mostly from the coordination leases (leases) that the
scheduler, the controller-manager and the API server renew all the time. A
production cluster with its controllers, its operators and its users
produces several orders of magnitude more. The level: None rules
are therefore not cosmetic, and neither is file rotation.
The four audit levels
Each rule of the policy specifies a level that determines how much
information is recorded. The choice is made resource by resource: a
single log mixes Metadata and RequestResponse events, according to the
first rule that matches the request.
| Level | What is recorded | Usage |
|---|---|---|
None | Nothing | Exclude resources from logging (avoid noise) |
Metadata | Request metadata (user, timestamp, resource, verb) but not the body | Basic audit, low volume |
Request | Metadata + request body | See what was sent |
RequestResponse | Metadata + request + response | Full debugging, high volume |
The four stages of an event
An event can be recorded at different stages of its processing.
In practice, you keep ResponseComplete, which carries the return
code, and you omit RequestReceived, which would double every request
without teaching anything more.
| Stage | Moment | Usage |
|---|---|---|
RequestReceived | As soon as received, before processing | Exhaustive logging |
ResponseStarted | Response headers sent (watch/long-running) | Long requests |
ResponseComplete | Response finished | Standard, the most used |
Panic | If the API Server panics | Debugging only |
Create an audit policy
An audit policy is a YAML file made of a list of rules evaluated from top to bottom: the first rule that matches the request wins, the following ones are ignored. Order is therefore structural: a general rule placed at the top neutralises everything after it. Without a policy, the API server logs nothing at all.
Basic structure
This reference policy handles the cases from the most specific to the most
general: it first drops the noise of health probes, then protects
sensitive resources at the Metadata level, and ends with a catch-all rule.
It is the one that served for the measurements of this page.
apiVersion: audit.k8s.io/v1kind: Policy# Stages omitted for all rules: RequestReceived would double every requestomitStages:  - "RequestReceived"rules:  # Rules are evaluated in order, first match wins
  # 1. API server health probes: nothing  - level: None    nonResourceURLs:      - "/healthz*"      - "/livez*"      - "/readyz*"
  # 2. Secrets/ConfigMaps/TokenRequests: Metadata only (never the content)  # IMPORTANT: RequestResponse would expose sensitive values in the logs!  - level: Metadata    resources:      - group: ""        resources: ["secrets", "configmaps", "serviceaccounts/token"]      - group: authentication.k8s.io        resources: ["tokenreviews"]
  # 3. RBAC changes: full bodies, for traceability  - level: RequestResponse    resources:      - group: "rbac.authorization.k8s.io"        resources: ["roles", "rolebindings", "clusterroles", "clusterrolebindings"]
  # 4. Actions on pods, exec and port-forward included: Metadata  - level: Metadata    resources:      - group: ""        resources: ["pods", "pods/exec", "pods/portforward"]
  # 5. Default rule: Metadata for everything else  - level: Metadata
A word on the first rule, because it is often written differently.
The health probes from the kubelet to the API server are anonymous
requests on URLs without a resource: in the log, they carry the user
system:anonymous and the agent kube-probe/1.37. A rule that filtered on a
user name or on the endpoints and services resources would never catch
them; only nonResourceURLs sees them, and the measurement above shows that
it brings them down to zero.
Minimal policy for the CKS
For the CKS exam, here is a shorter but functional policy. It keeps the three gestures that count: dropping the probes, protecting the Secrets, tracing RBAC.
apiVersion: audit.k8s.io/v1kind: PolicyomitStages:  - "RequestReceived"rules:  # Ignore health endpoints  - level: None    nonResourceURLs:      - "/healthz*"      - "/readyz*"      - "/livez*"
  # Secrets, ConfigMaps, tokens: Metadata only (not the content)  - level: Metadata    resources:      - group: ""        resources: ["secrets", "configmaps", "serviceaccounts/token"]      - group: authentication.k8s.io        resources: ["tokenreviews"]
  # RBAC: RequestResponse for full traceability  - level: RequestResponse    resources:      - group: "rbac.authorization.k8s.io"
  # Metadata for everything else  - level: Metadata
Available filters
The criteria of a rule combine with a logical AND: the request must satisfy all the fields present for the rule to apply. Within a single field, however, the listed values work as an OR.
rules:  - level: Metadata    # Filter by user    users: ["admin", "system:serviceaccount:default:myapp"]    userGroups: ["system:authenticated"]
    # Filter by verb    verbs: ["create", "update", "delete"]
    # Filter by resource    resources:      - group: ""       # core API group        resources: ["pods", "services"]      - group: "apps"        resources: ["deployments"]
    # Filter by namespace    namespaces: ["production", "finance"]
    # Non-resource URLs (healthz, metrics)    nonResourceURLs: ["/api*", "/version"]
    # Stages to omit for this rule    omitStages: ["RequestReceived"]
Wildcard group: "*" (Kubernetes 1.36)
Since Kubernetes 1.36, the audit API accepts the value "*" in the
group field to target all API groups at once, without having to list
them. This is handy for a baseline policy that must cover CRDs
added over time. On an earlier version, the value is taken as a literal
group name and the rule matches nothing.
rules: - level: Metadata # All resources of all groups resources: - group: "*" resources: ["*"] # Can be combined with a verb filter to limit the volume verbs: ["create", "update", "delete", "patch"] omitStages: ["RequestReceived"]Configure the API server
Writing the policy is not enough: you must have the API server read it and tell it where to put the events. On a cluster installed with kubeadm, this goes through the component's static manifest, which the kubelet watches permanently. Any syntax error in this file prevents the API server from restarting, and therefore the whole cluster from answering: work with a backup copy of the manifest.
kubeadm / self-managed clusters
These six steps must be carried out on every control plane node, because each API server has its own manifest and its own log file. Expect about thirty seconds of API unavailability at each restart: measured on kind, between 27 and 33 s.
-
Back up the manifest, outside the manifests folder
Terminal window sudo cp /etc/kubernetes/manifests/kube-apiserver.yaml /root/kube-apiserver.yaml.avant-auditNever put a copy in
/etc/kubernetes/manifests/: the kubelet reads every file there, and a copy would start a second API server. -
Create the policy file
Terminal window sudo mkdir -p /etc/kubernetes/auditsudo vim /etc/kubernetes/audit/audit-policy.yamlPaste the YAML policy.
-
Modify the API server manifest
Terminal window sudo vim /etc/kubernetes/manifests/kube-apiserver.yamlAdd the flags:
spec:containers:- command:- kube-apiserver# ... other existing flags ...- --audit-policy-file=/etc/kubernetes/audit/audit-policy.yaml- --audit-log-path=/var/log/kubernetes/audit/audit.log- --audit-log-maxage=30 # Retention in days- --audit-log-maxbackup=10 # Number of files to keep- --audit-log-maxsize=100 # Max size in MB before rotation -
Add the volumes and volumeMounts
spec:containers:- volumeMounts:# ... existing mounts ...- mountPath: /etc/kubernetes/auditname: audit-policyreadOnly: true- mountPath: /var/log/kubernetes/auditname: audit-logsvolumes:# ... existing volumes ...- name: audit-policyhostPath:path: /etc/kubernetes/audittype: DirectoryOrCreate- name: audit-logshostPath:path: /var/log/kubernetes/audittype: DirectoryOrCreate -
Create the log directory
Terminal window sudo mkdir -p /var/log/kubernetes/audit -
Check the API server restart
Terminal window # The API server restarts automatically (the kubelet watches /etc/kubernetes/manifests)kubectl get pods -n kube-system | grep api# Check the logssudo tail -f /var/log/kubernetes/audit/audit.log | jq .
Complete manifest example
Here are steps 3 and 4 put together in a single file, to check that
nothing is missing: the five --audit-* flags, the two
volumeMounts and the two matching hostPath entries. A forgotten mount
shows up as an API server in CrashLoopBackOff.
apiVersion: v1kind: Podmetadata: name: kube-apiserver namespace: kube-systemspec: containers: - name: kube-apiserver command: - kube-apiserver - --advertise-address=10.0.0.10 - --allow-privileged=true - --authorization-mode=Node,RBAC # ... other flags ... - --audit-policy-file=/etc/kubernetes/audit/audit-policy.yaml - --audit-log-path=/var/log/kubernetes/audit/audit.log - --audit-log-maxage=30 - --audit-log-maxbackup=10 - --audit-log-maxsize=100 volumeMounts: - mountPath: /etc/kubernetes/audit name: audit-policy readOnly: true - mountPath: /var/log/kubernetes/audit name: audit-logs volumes: - hostPath: path: /etc/kubernetes/audit type: DirectoryOrCreate name: audit-policy - hostPath: path: /var/log/kubernetes/audit type: DirectoryOrCreate name: audit-logsThe three rotation flags are worth setting explicitly, even though they have default values. Since Kubernetes 1.36, a log with no setting is kept for 366 days and 100 files of 100 MB: up to 10 GB on the disk of the control plane. The values in this guide, 30 days and 10 files of 100 MB, cap it at 1 GB per node.
Webhook backend (optional)
To send events to an external system (SIEM, Elasticsearch), the API server can also push them over HTTPS to a collector. The configuration is a standard kubeconfig, which names the server and the certificate authority to present to it.
apiVersion: v1kind: Configclusters: - name: audit-webhook cluster: server: https://siem.example.com/k8s-audit certificate-authority: /etc/kubernetes/pki/ca.crtcontexts: - name: audit-webhook context: cluster: audit-webhookcurrent-context: audit-webhookAPI server flags for the webhook:
--audit-webhook-config-file=/etc/kubernetes/audit/audit-webhook-config.yaml--audit-webhook-initial-backoff=5s--audit-webhook-batch-max-size=1000Analyse the audit logs
The audit file contains one JSON object per line, which makes it
directly usable with jq. Each line is a complete, self-contained
event: it carries the identity of the caller, the requested action, the
targeted resource and the return code. Knowing how to read these four fields is
enough to run most investigations.
Structure of an event
Four fields come first: user.username says who,
verb says what, objectRef says on which resource, and
responseStatus.code says with what result. sourceIPs completes
the picture by giving the network origin of the request. The event below
is the real one for the creation of a Secret under the reference policy:
Metadata level, so no object body.
{ "kind": "Event", "apiVersion": "audit.k8s.io/v1", "level": "Metadata", "auditID": "555dd97f-59ca-4fc2-be9e-f7e916f849d9", "stage": "ResponseComplete", "requestURI": "/api/v1/namespaces/audit-demo/secrets?fieldManager=kubectl-create&fieldValidation=Strict", "verb": "create", "user": { "username": "kubernetes-admin", "groups": ["kubeadm:cluster-admins", "system:authenticated"] }, "sourceIPs": ["172.26.0.1"], "userAgent": "kubectl/v1.36.0 (linux/amd64) kubernetes/ecf6dec", "objectRef": { "resource": "secrets", "namespace": "audit-demo", "name": "api-token", "apiVersion": "v1" }, "responseStatus": { "metadata": {}, "code": 201 }, "requestReceivedTimestamp": "2026-10-05T19:05:22.649105Z", "stageTimestamp": "2026-10-05T19:05:22.651755Z", "annotations": { "authorization.k8s.io/decision": "allow", "authorization.k8s.io/reason": "RBAC: allowed by ClusterRoleBinding \"kubeadm:cluster-admins\" of ClusterRole \"cluster-admin\" to Group \"kubeadm:cluster-admins\"" }}The annotations are worth a look: they say which RBAC rule allowed the
request. On a 403, they carry the reason for the refusal instead,
which shortens an investigation into a privilege escalation a lot.
Common investigation queries
Each of these jq filters answers a precise question asked during an incident. Denied accesses, code 403, deserve particular attention: a burst of 403s on a single service account often betrays an attempt at privilege escalation.
# All Secret creationscat audit.log | jq 'select(.verb=="create" and .objectRef.resource=="secrets")'
# Actions of a specific usercat audit.log | jq 'select(.user.username=="suspicious-user")'
# Denied accesses (403)cat audit.log | jq 'select(.responseStatus.code==403)'
# All actions in a namespacecat audit.log | jq 'select(.objectRef.namespace=="production")'
# Exec into podscat audit.log | jq 'select(.objectRef.subresource=="exec")'
# Top 10 most active userscat audit.log | jq -r '.user.username' | sort | uniq -c | sort -rn | head -10
# Actions of the last 5 minutescat audit.log | jq --arg d "$(date -u -d '5 minutes ago' +%Y-%m-%dT%H:%M:%SZ)" \  'select(.stageTimestamp > $d)'
Reconstruct an incident timeline
A usable timeline comes from combining three filters: the API
group concerned, a time window and the exclusion of read
verbs (get, list, watch), which would drown the modifications in
normal traffic.
# Example: who modified RBAC yesterday?cat audit.log | jq --arg start "2025-06-18T00:00:00Z" --arg end "2025-06-19T00:00:00Z" \ 'select( .objectRef.apiGroup=="rbac.authorization.k8s.io" and .verb!="get" and .verb!="list" and .verb!="watch" and .stageTimestamp > $start and .stageTimestamp < $end ) | {time: .stageTimestamp, user: .user.username, verb, resource: .objectRef.resource, name: .objectRef.name}'Falco integration
Falco can analyse Kubernetes audit logs for advanced detections, for example a burst of Secret reads by a service account. See the Falco guide for the configuration of the K8s Audit plugin.
Managed clusters
On a managed cluster, the audit logs are handled by the provider. You generally cannot customise the policy, but the logs are centralised automatically and can be read with the provider's tools.
AWS EKS sends the audit logs to CloudWatch Logs. By default, no control plane log is enabled: you must explicitly request the types audit, api and authenticator.
# Enable audit logs (control plane logging)eksctl utils update-cluster-logging \ --cluster my-cluster \ --enable-types audit,api,authenticator \ --region eu-west-1The same activation with the AWS CLI:
aws eks update-cluster-config \ --name my-cluster \ --logging '{"clusterLogging":[{"types":["audit","api","authenticator"],"enabled":true}]}'To read the logs:
# The logs are in the /aws/eks/<cluster>/cluster groupaws logs filter-log-events \ --log-group-name /aws/eks/my-cluster/cluster \ --log-stream-name-prefix kube-apiserver-audit \ --filter-pattern '{ $.verb = "create" && $.objectRef.resource = "secrets" }'CloudWatch Logs Insights lets you query these logs in a syntax close to SQL, more comfortable than the filtering above as soon as the search gets complicated. Keep in mind that these logs are billed by volume, at ingestion as well as at storage: a policy that is too broad is paid for on the invoice as much as in readability.
GKE uses Cloud Audit Logs, enabled by default. Two types of logs:
- Admin Activity: creations, modifications, deletions (always enabled, free)
- Data Access: reads (disabled by default, paid)
# Check the cluster configurationgcloud container clusters describe my-cluster \  --format="yaml(loggingConfig)"
# Enable Data Access logs (optional, generates volume)gcloud projects get-iam-policy PROJECT_ID \  --format=yaml > policy.yaml# Edit to add auditConfigs for GKE
Read the logs in Cloud Logging:
resource.type="k8s_cluster"protoPayload.methodName:"secrets"protoPayload.authenticationInfo.principalEmail:"user@example.com"A limit specific to managed clusters awaits you here: you cannot customise the GKE audit policy. Everything this guide explains about writing rules therefore does not apply there, and the logs follow the Cloud Audit Logs format, different from the native Kubernetes format you saw above. Your queries and your analysis tools must take this into account.
AKS exposes the audit logs through Azure Monitor and Diagnostic Settings. Several categories are available:
kube-audit: full audit (high volume)kube-audit-admin: write operations only (recommended)
# Create a Log Analytics workspace if neededaz monitor log-analytics workspace create \  --resource-group myRG \  --workspace-name myWorkspace
# Enable diagnostic settingsCLUSTER_ID=$(az aks show -g myRG -n my-cluster --query id -o tsv)WORKSPACE_ID=$(az monitor log-analytics workspace show \  -g myRG -n myWorkspace --query id -o tsv)
az monitor diagnostic-settings create \  --name aks-audit \  --resource "$CLUSTER_ID" \  --workspace "$WORKSPACE_ID" \  --logs '[{"category":"kube-audit-admin","enabled":true}]'
To query the logs with a KQL query in Log Analytics:
AzureDiagnostics| where Category == "kube-audit-admin"| extend auditLog = parse_json(log_s)| where auditLog.objectRef.resource == "secrets"| project TimeGenerated, User=auditLog.user.username, Verb=auditLog.verb, Resource=auditLog.objectRef.name| order by TimeGenerated descThe choice of category is the decision that costs the most here.
kube-audit captures everything, reads included, and generates a
considerable volume on an active cluster. kube-audit-admin is limited
to write operations, which covers nearly all security needs
for a fraction of the volume. Choose the first only
if a specific investigation requires it, and switch back to the second
afterwards.
Troubleshooting
Two symptoms dominate after enabling audit: the API server refuses
to restart, or it starts without producing any file. The first
case is diagnosed in the kubelet logs, since the API server is
no longer reachable by kubectl; the second almost always comes from a missing
flag or an unmounted directory.
The API server does not restart
When the API server is down, kubectl no longer answers: the only source of information is the local kubelet, which logs the startup failure of the static Pod.
# Check the errorssudo journalctl -u kubelet | grep -i apiserver | tail -50
# Common YAML errorssudo cat /etc/kubernetes/manifests/kube-apiserver.yaml | yq .
The three most frequent causes are recognised by their message:
| Symptom | Cause | Solution |
|---|---|---|
| "audit policy file not found" | Wrong path or missing file | Check the path and the permissions |
| "invalid audit policy" | Invalid YAML | Validate the YAML with yq . policy.yaml or a linter |
| CrashLoopBackOff API Server | Incorrect volume mount | Check hostPath and mountPath |
No logs are generated
An empty file is not necessarily a failure: the policy may simply capture nothing. First check that the flags were really passed to the process, then trigger a deliberately logged action to confirm.
# Check that audit is activeps aux | grep kube-apiserver | grep audit
# The flags must appear# --audit-policy-file=/etc/kubernetes/audit/audit-policy.yaml# --audit-log-path=/var/log/kubernetes/audit/audit.log
# Check the directory permissionsls -la /var/log/kubernetes/audit/
# Generate an action to create logskubectl create secret generic test-audit --from-literal=key=valuekubectl delete secret test-audit
Best practices
Audit is tuned as a trade-off between volume and evidential value. A policy that is too broad saturates the disk of the control plane and makes searches unusable; a policy that is too narrow leaves blind spots at the moment you need them. The four habits below hold this trade-off.
Exclude the noise
Use level: None on health probes (nonResourceURLs) and on the most frequent reads.
RequestResponse sparingly
Reserve this level for RBAC. Never for Secrets or ConfigMaps, which stay at Metadata.
Log rotation
Configure maxage, maxbackup, maxsize to avoid filling the disk.
Centralise the logs
Use a webhook to a SIEM/Elasticsearch for long retention.
Hands-on practice
An audit policy is proven by reading back the log it has just
produced. This lab has you give the API server a two-level
policy on a real control plane, where the policy file and the static
manifest are yours. The statement, modelled on an exam task, asks for the
opposite of the production rule: full bodies for Secrets, metadata for the
rest. What is graded is the mechanics, the order of the rules, the mounts, the restart of the API server
and the reading of the log; remember that in production, the rule for Secrets stays
Metadata.
Challenge: fix the CIS gaps of a cluster
The challenge is the unaided proof of the module "Harden the cluster", and it is graded on the state of the control plane you leave behind, not on the commands you typed. On a kubeadm cluster fresh from a default installation, the API server exposes its profiler and audits nothing. You harden it without breaking it, you fix the gap that the CIS audit reports on three control plane components, you prove it by running kube-bench again, then you give the API server a two-level audit policy. No procedure is given to you.
The validation reads seven states, with no solution or value to copy. It reads the manifests of the node, runs kube-bench itself again and compares its number of failures with the one measured at the start. It then makes two real reads, that of a Secret and an ordinary read, and reads back what the API server has just written in its log.
Passing requires 70 points out of 100, and there is no hint. Two states are blocking and must pass whatever the total: kube-bench, run again, counts fewer failures than at the start, and the audit log records a Secret read in full and an ordinary read as metadata only. dsoxlab check lists the states that are not satisfied, without saying how to fix them: the lesson to go back to is the one that teaches that state. The challenge builds on this lesson and on The CIS Kubernetes benchmark.
Key takeaways
| Concept | Description |
|---|---|
| Audit Policy | YAML file defining what to log and at what level; the first matching rule wins |
| Levels | None < Metadata < Request < RequestResponse |
| Secrets | Always Metadata: RequestResponse copies their values in base64 into the log |
| Health probes | level: None on nonResourceURLs /healthz*, /livez*, /readyz*: 38% of the volume at rest |
| Stages | RequestReceived, ResponseStarted, ResponseComplete, Panic |
| File backend | --audit-log-path for local logs, plus the two hostPath mounts |
| Webhook backend | To send to external systems (SIEM) |
| Rotation | --audit-log-maxage/maxbackup/maxsize; with no setting, 366 days and 100 files since 1.36 |
Knowledge check
Seven questions drawn from the Kubernetes bank of the course, on logging and auditing, to be taken in eight minutes with 70% correct answers to pass.
Knowledge check
Check what you have learned with this interactive quiz
How it works
- The timer starts when you click Start
- Multiple choice, true/false and short answer questions
- You can move between questions
- Detailed results are shown at the end
Starts the quiz and the timer
Review
(0/0)Score by domain
A domain groups several guides and gets several questions, so its score is more reliable than a per-topic score, which often rests on a single question.
Summary
Strengths
No topic passed at 80% on at least two questions yet.
Weak areas
No topic below the pass mark.
Recommended next
Hints before you try again?
Continue the course: Falco - Runtime threat detection in Kubernetes
A new full quiz with random questions
Work again only on the questions you missed