To reach from your workstation an application running in the cluster, kubectl offers three commands: kubectl expose creates a durable Service, kubectl port-forward opens a temporary tunnel to a Pod, and kubectl proxy puts the Kubernetes API within reach of curl. The lesson Services taught you to give your Pods a stable address, but a ClusterIP address can only be reached from inside the cluster. This lesson shows you how to test an application from your machine, without opening anything to the rest of the network, and what each command really does. It builds on the selectors of the Labels and annotations lesson, which expose and port-forward read to find their Pods.
Prerequisites: the lessons Labels and annotations and Services, the demo cluster from First cluster, kubectl configured and curl on your workstation.
What you will learn
- Choose between
expose,port-forwardandproxyaccording to the lifetime of the access - Generate the manifest of a Service with
kubectl expose --dry-run=client -o yaml - Open a tunnel to a Pod, a Deployment or a Service with
kubectl port-forward - Understand why a tunnel to a Service drops when its Pod disappears
- Query the Kubernetes API and reach a Service through
kubectl proxy
Which command for which access?
The criterion that separates the three commands is the lifetime of the access. kubectl expose creates an object in the cluster, which outlives your session and which everyone can use. The other two create nothing: they start a process on your workstation, and the access disappears as soon as you stop it with Ctrl+C.
| Need | Command | Lifetime | What it does |
|---|---|---|---|
| Give an application a stable address | kubectl expose | Permanent | Creates a Service object |
| Test or debug an application from your workstation | kubectl port-forward | As long as the command runs | TCP tunnel from your workstation to one Pod |
| Explore the Kubernetes API, or reach a Service over HTTP | kubectl proxy | As long as the command runs | Local HTTP proxy to the API server |
The examples in the lesson run on an echo Deployment with two replicas. Its image, agnhost, is a small test application published by the Kubernetes project: on the /hostname path, it answers the name of the Pod that handled the request, which lets you see which Pod answers.
kubectl create deployment echo --replicas=2 --port=8080 \ --image=registry.k8s.io/e2e-test-images/agnhost:2.61@sha256:101f3357d1ad890c3090e78ea6c6a47dc5137cbe19836796e13d5dcb2b84d2e6 \ -- /agnhost netexec --http-port=8080kubectl rollout status deployment/echodeployment.apps/echo createdWaiting for deployment "echo" rollout to finish: 0 out of 2 new replicas have been updated...Waiting for deployment "echo" rollout to finish: 0 of 2 updated replicas are available...Waiting for deployment "echo" rollout to finish: 1 of 2 updated replicas are available...deployment "echo" successfully rolled outkubectl expose: what it copies, what it guesses
kubectl expose deployment echo --port=80 --target-port=8080 creates a ClusterIP Service that reuses the selector of the Deployment. The Services lesson showed the command and the Service types; remember here the three things it does for you, because they explain its surprises.
The first: the selector of the Service is copied from that of the Deployment, here app=echo. This is the mechanism of the Labels and annotations lesson: the Service does not know its Pods, it finds them through their labels. The second: an omitted --target-port takes the value of --port. The third: without --port, kubectl looks for a containerPort declared in the Pod template. If it finds none, as on a Deployment created without --port, the command fails:
error: couldn't find port via --port flag or introspectionThe point of expose is not only to create the Service, though: it also serves to write its manifest. With --dry-run=client -o yaml, kubectl sends nothing to the cluster and prints the Service it would have created, ready to be saved to a file and versioned:
kubectl expose deployment echo --port=80 --target-port=8080 --dry-run=client -o yamlapiVersion: v1kind: Servicemetadata: labels: app: echo name: echospec: ports: - port: 80 protocol: TCP targetPort: 8080 selector: app: echostatus: loadBalancer: {}You thus start from a correct YAML instead of writing it from memory. The status block is filled in by the cluster and can be removed from the file. Now create the Service for the rest of the lesson, by running the command again without --dry-run:
kubectl expose deployment echo --port=80 --target-port=8080kubectl get svc echokubectl get endpointslice -l kubernetes.io/service-name=echoservice/echo exposedNAME TYPE CLUSTER-IP EXTERNAL-IP PORT(S) AGEecho ClusterIP 10.96.98.68 <none> 80/TCP 0sNAME ADDRESSTYPE PORTS ENDPOINTS AGEecho-98jk4 IPv4 8080 10.244.3.2,10.244.2.2 0sThe Service has two endpoints, one per Pod of the Deployment, and they carry port 8080 of the Pods.
kubectl port-forward: a tunnel from your workstation to a Pod
kubectl port-forward opens a port on your machine and relays each connection to a Pod of the cluster, going through the API server. You need no network route to the nodes and no NodePort Service: only your kubectl rights. It is the tool for the one-off test: checking that an application answers, consulting an administration interface, plugging in a local database client.
The syntax: local port first
The order of the ports reads local, then remote: 8080:3000 opens port 8080 on your workstation to port 3000 of the target. Swapping the two ports is a classic mistake. The target is designated by its type and name, pod/<name>, deployment/<name> or svc/<name>.
kubectl port-forward <type>/<nom> <port-local>:<port-distant>To a Pod
The most direct case targets a Pod by its name. The name of a Pod is generated by Kubernetes: look it up first with kubectl get pods, and keep it in a shell variable. The port-forward command normally stays in the foreground and prints one line per relayed connection; so that the example can be replayed in a single terminal, it is started in the background with &, its output is written to a file, and the tunnel is stopped with kill.
kubectl get pods -l app=echoPOD=$(kubectl get pods -l app=echo -o name | head -n 1)kubectl port-forward "$POD" 8080:8080 > pf-pod.log 2>&1 &PF=$!sleep 2curl -s http://localhost:8080/hostnameechoecho "$POD"cat pf-pod.logkill $PFNAME READY STATUS RESTARTS AGEecho-6485ccfc8c-g86vg 1/1 Running 0 9secho-6485ccfc8c-x979q 1/1 Running 0 9secho-6485ccfc8c-g86vgpod/echo-6485ccfc8c-g86vgForwarding from 127.0.0.1:8080 -> 8080Forwarding from [::1]:8080 -> 8080Handling connection for 8080The first two lines of the log are the IPv4 and IPv6 listeners of your workstation, and the third appears at each relayed connection. In a terminal, you would run port-forward without & and the curl in a second terminal. The name answered by curl is that of the targeted Pod: the request did cross the tunnel. The weakness of this form is the Pod name, which changes every time the Pod is recreated.
To a Service: a single Pod, chosen at launch
You can also target svc/echo or deployment/echo. But the tunnel does not go through the Service: kubectl reads the selector, picks a single Pod at launch and attaches to it. There is no load balancing, and no switch to another Pod. Start the tunnel to the Service, then send six calls to /hostname:
kubectl port-forward svc/echo 8080:80 > pf-svc.log 2>&1 &PF=$!sleep 2for i in $(seq 1 6); do curl -s http://localhost:8080/hostname; echo; donecat pf-svc.logecho-6485ccfc8c-x979qecho-6485ccfc8c-x979qecho-6485ccfc8c-x979qecho-6485ccfc8c-x979qecho-6485ccfc8c-x979qecho-6485ccfc8c-x979qForwarding from 127.0.0.1:8080 -> 8080Forwarding from [::1]:8080 -> 8080Handling connection for 8080Handling connection for 8080Handling connection for 8080Handling connection for 8080Handling connection for 8080Handling connection for 8080Two details can be read in this output. Port 80 of the Service was translated into 8080, the targetPort of the Pod: the proof that the tunnel goes straight to the Pod. And the six calls were all answered by the same Pod, although the Service has two. The log also counts six Handling connection lines, one per call.
Then delete all the Pods of the application. With svc/echo, it is kubectl that chooses, at launch, the Pod the tunnel attaches to, and it is not necessarily the first in the list: deleting a single Pod might leave the tunnel intact. The ReplicaSet recreates the two Pods within a few seconds, but the tunnel drops: the next request fails and the port-forward command stops by itself. The failure of curl is intended, and the message curl : échec (code 52) is its trace:
kubectl delete pod -l app=echosleep 3curl -s -m 3 http://localhost:8080/hostname || echo "curl : échec (code $?)"wait $PF; echo "code de wait : $?"cat pf-svc.logkubectl rollout status deployment/echopod "echo-6485ccfc8c-g86vg" deleted from default namespacepod "echo-6485ccfc8c-x979q" deleted from default namespacecurl : échec (code 52)code de wait : 1Forwarding from 127.0.0.1:8080 -> 8080Forwarding from [::1]:8080 -> 8080Handling connection for 8080Handling connection for 8080Handling connection for 8080Handling connection for 8080Handling connection for 8080Handling connection for 8080Handling connection for 8080E1111 08:07:05.621667 17959 portforward.go:549] "An error occurred forwarding" err="error forwarding port 8080 to pod f2c220b45c715ca6712452a1df36d47864cf341beca6bbbbde13f95da7d05ab2, uid : network namespace for sandbox \"f2c220b45c715ca6712452a1df36d47864cf341beca6bbbbde13f95da7d05ab2\" is closed" localPort=8080 remotePort=8080error: lost connection to podWaiting for deployment "echo" rollout to finish: 1 of 2 updated replicas are available...deployment "echo" successfully rolled outThe curl code 52 means that the connection was accepted and then cut without a response, which is what the tunnel does when its Pod disappears. The log now counts seven Handling connection lines: the six calls of the previous section, plus the attempt that just failed. It ends with the error error: lost connection to pod, preceded by a detailed message saying that the network environment of the deleted Pod is closed. The line code de wait : 1 shows that the port-forward command stopped with a failure. Finally, rollout status confirms that the ReplicaSet recreated the deleted Pods.
Targeting a Service remains convenient, because you do not have to look for a Pod name. But it is not a guarantee of continuity: when a Pod is recreated, by an update or a restart, run the command again, and it will pick a live Pod.
Several ports, or a free local port
A single command can open several redirections to the same target, by chaining local:remote pairs: useful when an application serves its traffic and its metrics on two ports. If the local port is already taken, write :80 without a local port: the system picks a free one and the command prints it (here 37703, yours will be different).
kubectl port-forward svc/echo :80 > pf-libre.log 2>&1 &PF=$!sleep 2cat pf-libre.logkill $PFForwarding from 127.0.0.1:37703 -> 8080Forwarding from [::1]:37703 -> 8080By default, the tunnel only listens on 127.0.0.1: only you can use it. The --address 0.0.0.0 option opens it to all the machines of your network, which then reach the application without any authentication. Use it only on a trusted network.
To keep the terminal free, start the command in the background with &, as above, and stop it with kill. A forgotten tunnel occupies a local port and a connection to the API server: close the ones you no longer use.
kubectl proxy: the Kubernetes API over local HTTP
kubectl proxy starts an HTTP server on your workstation that relays your requests to the API server, adding your credentials. Everything kubectl does goes through this REST API: with the proxy, you query it directly with curl or a browser, without a token or a certificate in the request.
Start the proxy
By default, the command listens on port 8001 of 127.0.0.1, and stays in the foreground until Ctrl+C; here, as for the tunnels, it is started in the background. The --port option changes the port; --port=0 lets the system choose a free one, printed at startup.
kubectl proxy --port=8001 > proxy.log 2>&1 &PROXY=$!sleep 2cat proxy.logStarting to serve on 127.0.0.1:8001Query the API with curl
The proxy runs in the background, and each path of the API becomes a URL. The /version path returns the version of the cluster; resources are read under /api/v1/, here the Pods of the default namespace. The answer is JSON: the complete object, with all the fields that kubectl get -o yaml already showed you.
curl -s http://localhost:8001/versioncurl -s http://localhost:8001/api/v1/namespaces/default/pods | head -n 12{ "major": "1", "minor": "37", "emulationMajor": "1", "emulationMinor": "37", "minCompatibilityMajor": "1", "minCompatibilityMinor": "36", "gitVersion": "v1.37.0", "gitCommit": "f54c212e3a2f75d674b717a9b29052b20b60aefc", "gitTreeState": "clean", "buildDate": "2026-08-26T10:44:25Z", "goVersion": "go1.26.6", "compiler": "gc", "platform": "linux/amd64"}{ "kind": "PodList", "apiVersion": "v1", "metadata": { "resourceVersion": "777" }, "items": [ { "metadata": { "name": "echo-6485ccfc8c-dvxpv", "generateName": "echo-6485ccfc8c-", "namespace": "default",In /version, minor is 37 and gitVersion is v1.37.0: it is indeed the demo cluster. The list begins with a PodList object. The head -n 12 command shortens the output: on a list of Pods, the answer quickly runs to several hundred lines. The proxy acts with your rights: a request that your account is not allowed to make with kubectl is refused in the same way through it.
Reach a Service through the proxy
The API server can relay a request to a Service of the cluster, which lets you open a ClusterIP application in your browser. The path follows a fixed format, where the port is optional when the Service declares only one:
http://localhost:8001/api/v1/namespaces/<namespace>/services/<service>[:<port>]/proxy/<chemin>for i in $(seq 1 6); do curl -s http://localhost:8001/api/v1/namespaces/default/services/echo:80/proxy/hostname; echo; doneecho-6485ccfc8c-dvxpvecho-6485ccfc8c-dvxpvecho-6485ccfc8c-qblx2echo-6485ccfc8c-qblx2echo-6485ccfc8c-qblx2echo-6485ccfc8c-qblx2Unlike port-forward, this path targets the Service on every request: the API server picks a ready Pod of the Service each time, so the requests are spread across its Pods, and a recreated Pod breaks nothing. In the output above, both Pods answer (twice one, four times the other out of six calls).
Two error responses are worth knowing. Without the trailing slash of /proxy/, the API server answers 301 Moved Permanently to the address with the slash: a browser follows the redirect, curl without -L prints an empty response. And a Service with no ready Pod answers 503 with the message no endpoints available for service, the symptom of the Service without endpoints seen in the Services lesson.
The proxy carries a default safeguard, visible in kubectl proxy --help: the --reject-paths option refuses by default the exec and attach paths of Pods, as well as proxy/run of nodes, and an attempt receives 403 Forbidden. This safeguard only blocks these three paths: listing, modifying or deleting objects remains possible through the proxy, hence the box above.
proxy or port-forward?
Both commands open a local port, but they do not carry the same thing. kubectl proxy only speaks HTTP, because it translates your requests into API calls; kubectl port-forward relays raw TCP, whatever the protocol of the application. For a PostgreSQL or Redis client, the question therefore does not arise: it is port-forward. The diagram shows where the difference lies: the tunnel stops at one Pod, whereas the proxy lets the API server choose a Pod of the Service at each request.
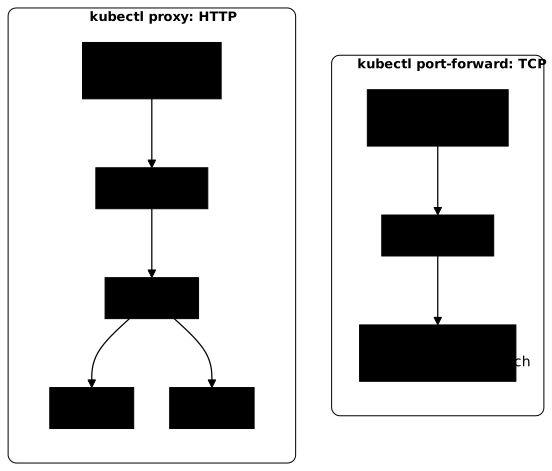
| Criterion | kubectl proxy | kubectl port-forward |
|---|---|---|
| What can be reached | The whole API, and Services over HTTP | One specific Pod |
| Protocol | HTTP only | TCP, any application protocol |
| To a Service | A ready Pod of the Service, chosen at each request | Attaches to one Pod chosen at launch |
| If the Pod is recreated | Nothing breaks | The tunnel drops, run the command again |
| Access URL | http://localhost:8001/api/v1/... | http://localhost:<local-port> |
For a regular access or one shared with a team, neither is suitable: you need an exposed Service, a topic that the course takes up again with Ingress.
How do you clean up what the lesson created?
Stop the proxy, delete the Service and the Deployment, and erase the logs written in the current directory:
kill $PROXYkubectl delete svc echokubectl delete deployment echorm -f pf-pod.log pf-svc.log pf-libre.log proxy.logservice "echo" deleted from default namespacedeployment.apps "echo" deleted from default namespaceTroubleshooting
Errors fall into two families. Launch errors are explicit: the command stops right away and says why, like a port already taken or a Pod that is not running. Routing errors are more discreet: the tunnel or the proxy starts, but the request fails, and the diagnosis then goes up the Service, EndpointSlice, Pod chain, as in the Services lesson.
| Symptom | Likely cause | Solution |
|---|---|---|
error: couldn't find port via --port flag or introspection (expose) | No containerPort declared in the Pod template | Pass --port (and --target-port) |
Unable to listen on port 8080 (...) bind: address already in use | The local port is already taken | Choose another local port, or :8080 for a free port |
error: unable to forward port because pod is not running. Current status=Pending | The Pod is not running yet, or its image does not download | kubectl get pods, wait for Running or fix the Pod |
error: lost connection to pod, the command stops | The targeted Pod was deleted or recreated | Run port-forward again, which will pick a live Pod |
listen tcp 127.0.0.1:8001: bind: address already in use (proxy) | Another proxy is already running | Stop the old one, or kubectl proxy --port=8002 |
301 Moved Permanently through the proxy | Trailing slash missing after /proxy | End the path with /proxy/ |
503, no endpoints available for service through the proxy | The Service has no ready Pod | kubectl get endpointslice -l kubernetes.io/service-name=<svc> |
Put it into practice
The guided lab starts from an echo Deployment with two replicas, without a Service, in the acces namespace of a kind cluster: add -n acces to your kubectl commands. You expose it through a Service that receives traffic on port 80 and sends it to port 8080 of the Pods, then you open a kubectl port-forward tunnel to this Service, in the background as in the lesson, on local port 18080. Finally, you note the name of the Pod that answered you through this tunnel, under the key pod-du-tunnel of ~/acces/releve.txt. The validation reads the ports of the Service, checks that its two Pods are ready endpoints, then looks for your tunnel among the processes of the machine and makes a request through port 18080 itself. The tunnel must therefore stay open until the check. The validation then compares your record with the Pod that answers: a forgotten targetPort, a closed tunnel or a name copied without having read it through the tunnel are rejected.
Key takeaways
kubectl exposecreates a durable Service;port-forwardandproxycreate nothing and stop with the command.kubectl expose ... --dry-run=client -o yamlwrites the manifest of a Service without creating anything; the selector is copied from the Deployment.port-forwardreadslocal:remoteand goes through the API server: no network route to the nodes is needed.- A
port-forwardtosvc/attaches to a single Pod chosen at launch: if that Pod disappears, the tunnel drops and the command stops. kubectl proxyserves the API over HTTP on127.0.0.1:8001, with your rights; it must never be opened to the network.- Through the proxy,
/api/v1/namespaces/<ns>/services/<svc>:<port>/proxy/reaches a Service by going through it. - Proxy = HTTP only; port-forward = TCP, so the choice for a database.
Test your knowledge
Six questions to check that you can choose the right command, read the syntax of a tunnel, predict what a port-forward becomes when its Pod disappears, and use the proxy safely.
Knowledge check
Check what you have learned with this interactive quiz
How it works
- The timer starts when you click Start
- Multiple choice, true/false and short answer questions
- You can move between questions
- Detailed results are shown at the end
Starts the quiz and the timer
Review
(0/0)Score by domain
A domain groups several guides and gets several questions, so its score is more reliable than a per-topic score, which often rests on a single question.
Summary
Strengths
No topic passed at 80% on at least two questions yet.
Weak areas
No topic below the pass mark.
Recommended next
Hints before you try again?
Continue the course: Kubernetes ConfigMaps: manage your application configuration
A new full quiz with random questions
Work again only on the questions you missed