Is your Kubernetes API server slow to answer? Do Pods take a long time to start? The problem may come from etcd, the database that stores the entire state of your cluster. This guide teaches you to diagnose and maintain etcd so you avoid outages and keep your infrastructure resilient.
What you will learn
- Explain what Kubernetes expects from etcd: consistency, latency, security
- Check the health of an etcd cluster in two minutes, and diagnose a slow or unstable etcd
- Explain why backing up etcd matters, the full procedure being in the Back up and restore lesson
- Carry out day-2 maintenance: compaction, defragmentation, quota,
NOSPACEalarms - Monitor etcd with Prometheus and interpret the signals
This guide is for cluster administrators and SREs, in production as well as when preparing for the CKA or the CKS. The concepts apply to kubeadm, k3s, RKE and any distribution that relies on etcd.
The published outputs come from a Kubernetes 1.37 cluster, whose bundled
image is etcd 3.7.0. Two practical consequences shape the rest of this page.
First, the split of tools has changed: etcdctl queries the server, while
offline operations on a file or a data directory, such as verifying and restoring
a snapshot, belong to etcdutl. Second, the image is distroless: it contains
neither sh nor tar, only the two binaries. Every command in this guide takes
that into account.
Why etcd is critical in Kubernetes
Kubernetes has no memory other than etcd: no persistent configuration file, no secondary database. The API server is a stateless service that turns your requests into reads and writes in this key-value database. Understanding this coupling explains most control plane incidents, and it is the starting point of every diagnosis on this page.
Exact role of etcd in Kubernetes
etcd is the single source of truth of your Kubernetes cluster. Everything the API server knows, Pods, Services, Secrets, ConfigMaps, RBAC, is stored in etcd.
| What etcd stores | Example |
|---|---|
| Desired state | "I want 3 replicas of nginx" |
| Current state | "2 Pods running, 1 pending" |
| Configuration | Secrets, ConfigMaps, ServiceAccounts |
| Metadata | Labels, annotations, finalizers |
| Leases | Controller leader election |
If etcd is slow, the API server is slow. If etcd is down, the API server can no longer persist state: existing workloads keep running, but no change is possible (creations, deletions, updates). Depending on how long the outage lasts, even reads through the API can degrade.
Redundancy only protects against what it was designed for. Three members protect against a machine failure, not against a slow disk, an unstable network or a quota reached: these three hit all three members at the same time and make the cluster unusable despite the quorum. Hence two non-negotiable hardware requirements, SSDs and a latency below 10 ms between members.
What this guide is not
This is not a "history" page about etcd. The goal is 100% operational: commands to copy and paste, and runbooks to solve common problems.
The etcd mental model in 15 minutes
Three mechanisms are enough to explain almost every etcd incident: the Raft consensus, which decides who may write; MVCC, which keeps the history of changes and makes the database grow; and the transactions, watches and leases primitives, which Kubernetes depends on constantly. Knowing them avoids treating symptoms without understanding the cause.
Raft: leader, followers, quorum
etcd uses the Raft algorithm to guarantee data consistency across all members. Here is how it works:
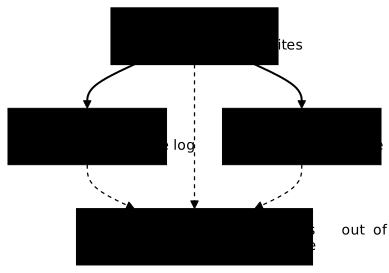
The rule to remember is simple: without a quorum (a majority of members available), no write is possible.
| Number of members | Quorum required | Fault tolerance |
|---|---|---|
| 1 | 1 | 0 (none) |
| 3 | 2 | 1 member |
| 5 | 3 | 2 members |
| 7 | 4 | 3 members |
You can check this tolerance in one step, once the lab of the "Reproducible lab with kind" section is deployed. Stop one of the three nodes, then ask for a write: it goes through.
docker stop etcd-lab-control-plane3kubectl create namespace lab-quorumnamespace/lab-quorum createdTwo members out of three do form the majority, so the cluster keeps accepting writes. What changes is the diagnosis: the status command explicitly reports the unreachable member and exits with code 1, which will make your monitoring fail, rightly so.
Failed to get the status of endpoint https://172.26.0.5:2379 (context deadline exceeded)If you stopped a second node, the majority would be lost: etcd would no longer accept any write. The workloads already started on the nodes still running would keep running, since it is the kubelets that maintain them, not etcd.
Restart each stopped node with docker start, for example
docker start etcd-lab-control-plane3, then check with
endpoint status --cluster that the three members answer. The following
sections assume all three members are running.
The number of members is therefore chosen within a narrow range. Three is the standard and suits most clusters, it tolerates the loss of one machine. Five is justified when downtime is very costly, it tolerates two. Beyond five, the gain becomes theoretical while the cost is very real: every write must be confirmed by the majority, and the larger the majority, the slower the write. An even number brings nothing either, four members tolerating the same single failure as three.
MVCC, revisions, compaction: why the database grows
etcd uses MVCC (Multi-Version Concurrency Control): every change creates a new revision without deleting the old one. This is what makes watches (real-time notifications) possible.
Without maintenance, the history piles up indefinitely.
Revision 1: pod-a createdRevision 2: pod-a modified (labels)Revision 3: pod-a modified (replicas)Revision 4: pod-a deleted ↓ All these revisions are kept!Two maintenance operations address this:
- compaction removes the old revisions and keeps the most recent one;
- defragmentation reclaims the disk space after compaction.
Transactions, watches, leases
etcd offers three primitives that Kubernetes uses heavily:
| Primitive | Kubernetes usage |
|---|---|
| Transactions | Atomic updates (create-or-update) |
| Watches | Controllers reacting to changes |
| Leases | Leader election, heartbeats |
In short, etcd is simple (key-value) but demanding on the quality of storage and network.
etcd topologies in Kubernetes
Two ways of installing etcd coexist: on the control plane nodes, or on dedicated machines. The choice changes how you back up, how you renew certificates and how you upgrade the cluster. Identifying your topology is the prerequisite for any intervention, because file paths and maintenance commands depend on it.
Stacked etcd (on the control planes)
This is the default topology with kubeadm and RKE2, and that of most distributions that embed etcd. k3s is an exception: its documentation states that SQLite is the default datastore, and it only switches to embedded etcd when asked to, or when etcd files already exist on disk. Each control plane node hosts one etcd member, so the number of members follows the number of control planes: adding a third control plane adds a third etcd member.
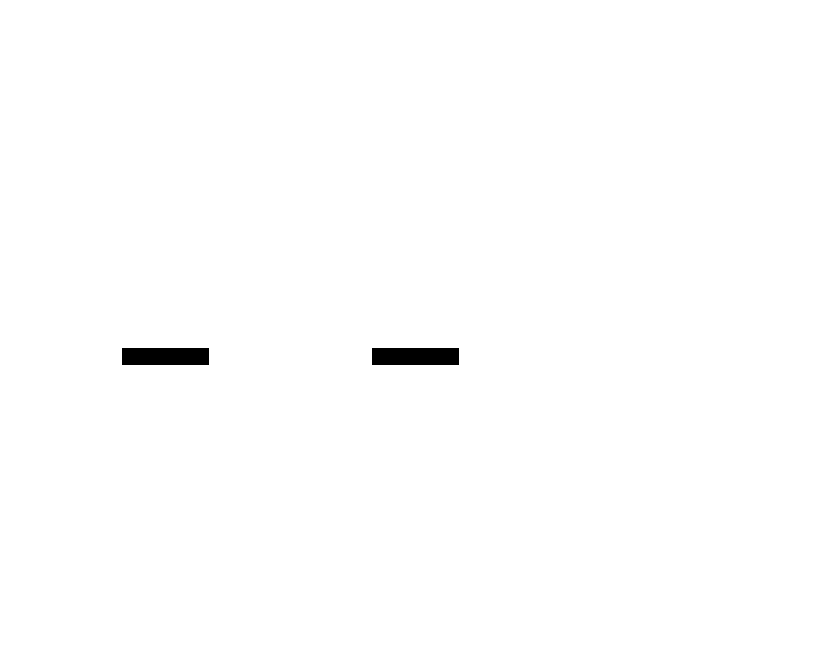
The stacked topology is simple and needs fewer machines. In return, when a control plane goes down, you also lose an etcd member.
External etcd (separate cluster)
For critical environments, etcd can run on dedicated machines.
This topology is justified in four cases:
- Resource isolation (dedicated CPU/RAM/disk)
- A different backup policy
- An etcd cluster shared between several K8s clusters
- Strict latency requirements
It makes operations heavier: you have to manage additional certificates, configure the endpoints and keep separate maintenance procedures.
Reproducible lab with kind
kind (Kubernetes in Docker) creates a complete cluster in containers, in a few minutes and without a virtual machine. With three control plane nodes, you get a real three-member etcd cluster, hence a real quorum to observe. The commands of this guide run on this lab, except those of the cheat sheet and the runbooks, which assume an etcdctl installed on a node.
The point is to learn the gestures without risking a production cluster, and
they carry over: only the certificate paths change from one distribution to
another, the etcdctl commands are the same everywhere.
Deploy a kind cluster with 3 control planes
The number of role: control-plane lines directly sets the number of etcd members. Three is the minimum to tolerate the loss of one member without losing the quorum.
-
Create the configuration file
kind-etcd-lab.yaml kind: ClusterapiVersion: kind.x-k8s.io/v1alpha4nodes:- role: control-plane- role: control-plane- role: control-plane -
Create the cluster
Terminal window kind create cluster --name etcd-lab --config kind-etcd-lab.yamlExpected output:
Creating cluster "etcd-lab" ...✓ Ensuring node image (kindest/node:v1.37.0) 🖼️✓ Preparing nodes 📦 📦 📦✓ Configuring the external load balancer ⚖️✓ Writing configuration 📜✓ Starting control-plane 🕹️✓ Installing CNI 🔌✓ Installing StorageClass 💾✓ Joining more control-plane nodes 🎮Set kubectl context to "kind-etcd-lab"Allow about one minute. The "Configuring the external load balancer" line only appears from two control planes on: kind puts a load balancer in front of the three API servers, which a single-node cluster does not have.
-
Check the etcd Pods
Terminal window kubectl get pods -n kube-system -l component=etcd -o wideExpected output:
NAME READY STATUS RESTARTS AGE IP NODEetcd-etcd-lab-control-plane 1/1 Running 0 60s 172.26.0.7 etcd-lab-control-planeetcd-etcd-lab-control-plane2 1/1 Running 0 18s 172.26.0.6 etcd-lab-control-plane2etcd-etcd-lab-control-plane3 1/1 Running 0 12s 172.26.0.5 etcd-lab-control-plane3
Accessing etcd securely
etcd requires mTLS (mutual TLS) authentication. Here is the recommended pattern for running etcdctl commands:
kubectl exec -n kube-system etcd-etcd-lab-control-plane -- etcdctl \ --cacert=/etc/kubernetes/pki/etcd/ca.crt \ --cert=/etc/kubernetes/pki/etcd/server.crt \ --key=/etc/kubernetes/pki/etcd/server.key \ --endpoints=https://127.0.0.1:2379 \ <COMMAND>etcdctl is called directly, without going through a shell. This is a
requirement, not a preference: the etcd image shipped with Kubernetes,
registry.k8s.io/etcd:3.7.0-0 in 1.37, is distroless. It contains neither
sh nor tar, only the etcdctl and etcdutl binaries. A
kubectl exec ... -- sh -c '...' gets this answer:
exec: "sh": executable file not found in $PATHTwo practical consequences. Without a shell in the image, you cannot export
ETCDCTL_* environment variables, which etcdctl can nevertheless read: the
options are therefore passed as flags. And ETCDCTL_API=3 is no longer
needed: the v3 API has been the default since etcd 3.4 and the only one in 3.7,
where the variable triggers the unrecognized environment variable warning.
Finally, --endpoints=https://127.0.0.1:2379 is better than the node's address:
the command runs inside the etcd container, so the loopback address is always
right there.
The lab examples use the server.crt certificate, which also works as a client
certificate. On a real cluster, prefer healthcheck-client.crt and its key,
which kubeadm provides for this purpose: these are the ones used in the
"etcdctl cheat sheet" section.
Repeating these five lines on every command quickly becomes tedious. A function defined on your workstation, not in the container, solves the problem for the whole session:
etcdctl-lab() { kubectl exec -n kube-system etcd-etcd-lab-control-plane -- etcdctl \ --cacert=/etc/kubernetes/pki/etcd/ca.crt \ --cert=/etc/kubernetes/pki/etcd/server.crt \ --key=/etc/kubernetes/pki/etcd/server.key \ --endpoints=https://127.0.0.1:2379 "$@"}In the diagnosis and maintenance sections, commands are shortened to
etcdctl --endpoints=https://127.0.0.1:2379 <command>. On the lab,
etcdctl-lab <command> does the same job: for example
etcdctl-lab endpoint health.
Validating connectivity
Three commands complement each other and do not answer the same question. endpoint health says whether a member accepts a write, endpoint status details its internal state, member list gives the declared membership. A member can appear in member list while being unreachable: it is this gap between the two views that reveals the failure.
Check the health of an endpoint
The test is not a simple connection opening: etcd actually submits a Raft proposal and measures how long it takes to be committed. A healthy endpoint therefore proves that the quorum works at that moment.
kubectl exec -n kube-system etcd-etcd-lab-control-plane -- etcdctl \ --cacert=/etc/kubernetes/pki/etcd/ca.crt \ --cert=/etc/kubernetes/pki/etcd/server.crt \ --key=/etc/kubernetes/pki/etcd/server.key \ --endpoints=https://127.0.0.1:2379 \ endpoint healthExpected output:
https://127.0.0.1:2379 is healthy: successfully committed proposal: took = 7.340476msCheck the status of all members
Use --cluster to query all members automatically (more robust than listing the IPs by hand):
kubectl exec -n kube-system etcd-etcd-lab-control-plane -- etcdctl \ --cacert=/etc/kubernetes/pki/etcd/ca.crt \ --cert=/etc/kubernetes/pki/etcd/server.crt \ --key=/etc/kubernetes/pki/etcd/server.key \ --endpoints=https://127.0.0.1:2379 \ endpoint status --cluster --write-out=tableExpected output, taken from the lab on etcd 3.7.0. The table is wide, sixteen columns, and is read diagonally: seven of them carry what is useful for diagnosis.
┌─────────────────────────┬──────────────────┬─────────┬─────────┬────────┬───────────────────────┬────────┬───────────┬───────────┬────────────┬────────┐│ ENDPOINT │ ID │ VERSION │ DB SIZE │ IN USE │ PERCENTAGE NOT IN USE │ QUOTA │ IS LEADER │ RAFT TERM │ RAFT INDEX │ ERRORS │├─────────────────────────┼──────────────────┼─────────┼─────────┼────────┼───────────────────────┼────────┼───────────┼───────────┼────────────┼────────┤│ https://172.26.0.6:2379 │ 370646228c096921 │ 3.7.0 │ 1.7 MB │ 1.7 MB │ 1% │ 2.1 GB │ false │ 2 │ 776 │ ││ https://172.26.0.7:2379 │ 69d49f43581645df │ 3.7.0 │ 1.7 MB │ 1.7 MB │ 1% │ 2.1 GB │ true │ 2 │ 776 │ ││ https://172.26.0.5:2379 │ e5237121cc9c0c3a │ 3.7.0 │ 1.7 MB │ 1.7 MB │ 1% │ 2.1 GB │ false │ 2 │ 776 │ │The excerpt above omits five columns to fit on screen: STORAGE VERSION,
IS LEARNER, RAFT APPLIED INDEX, DOWNGRADE TARGET VERSION and
DOWNGRADE ENABLED. Your output contains them, and RAFT APPLIED INDEX is used
in the baseline check below. The following table says what to look at in the
seven useful columns.
| Column | What it means | Expected value |
|---|---|---|
IS LEADER | Exactly one member must be the leader | Exactly 1 true |
DB SIZE | Size of the database file | Similar on all members |
IN USE | Part of that file actually used | Close to DB SIZE |
PERCENTAGE NOT IN USE | Space to reclaim by defragmentation | A few percent |
QUOTA | Ceiling beyond which the alarm triggers | 2.1 GB by default |
RAFT INDEX | Replication index | Identical on all members |
ERRORS | Active alarms | Empty |
Two of these columns did not exist in older versions and change the way you
work. QUOTA displays the ceiling in black and white, there is no need to
assume it any more: 2.1 GB, that is the 2 GiB default of etcd, on a cluster
where no --quota-backend-bytes is set. And PERCENTAGE NOT IN USE directly measures what defragmentation would reclaim, which turns an
operation previously decided by gut feeling into a numbers-based decision.
List the cluster members
This list reflects the declared membership of the cluster, as etcd knows it, not the actual state of the machines. It is the reference to consult before adding or removing a member, and the ID column provides the identifier that member remove expects.
kubectl exec -n kube-system etcd-etcd-lab-control-plane -- etcdctl \ --cacert=/etc/kubernetes/pki/etcd/ca.crt \ --cert=/etc/kubernetes/pki/etcd/server.crt \ --key=/etc/kubernetes/pki/etcd/server.key \ --endpoints=https://127.0.0.1:2379 \ member list --write-out=tableExpected output:
┌──────────────────┬─────────┬─────────────────────────┬─────────────────────────┬─────────────────────────┬────────────┐│ ID │ STATUS │ NAME │ PEER ADDRS │ CLIENT ADDRS │ IS LEARNER │├──────────────────┼─────────┼─────────────────────────┼─────────────────────────┼─────────────────────────┼────────────┤│ 370646228c096921 │ started │ etcd-lab-control-plane2 │ https://172.26.0.6:2380 │ https://172.26.0.6:2379 │ false ││ 69d49f43581645df │ started │ etcd-lab-control-plane │ https://172.26.0.7:2380 │ https://172.26.0.7:2379 │ false ││ e5237121cc9c0c3a │ started │ etcd-lab-control-plane3 │ https://172.26.0.5:2380 │ https://172.26.0.5:2379 │ false │└──────────────────┴─────────┴─────────────────────────┴─────────────────────────┴─────────────────────────┴────────────┘The rows follow the identifiers, not the names: do not read anything into the
fact that control-plane2 appears first.
Health and diagnosis: the checks that save you
During an incident, the classic mistake is to restart a member before understanding, at the risk of pushing the cluster below the quorum. The opposite method comes down to four checks with no side effects, then a targeted reading of the logs. The sections below give this sequence, then the frequent symptoms and their causes.
Baseline check (2 minutes)
Here is the sequence to run when there is a problem. The commands are written in short form: on the lab, etcdctl-lab endpoint health --cluster does the same job as the first one below, certificates included (the function is defined above).
-
Check that all members answer
Terminal window etcdctl --endpoints=https://127.0.0.1:2379 endpoint health --clusterExpected result: all endpoints are
healthy -
Identify the leader
Terminal window etcdctl --endpoints=https://127.0.0.1:2379 endpoint status --cluster --write-out=tableExpected result: only one member has
IS LEADER = true -
Check the consistency of the indexes
In the previous output,
RAFT INDEXandRAFT APPLIED INDEXmust be identical on all members. A gap indicates a replication problem. -
Check the alarms
Terminal window etcdctl --endpoints=https://127.0.0.1:2379 alarm listExpected result: empty output (no alarm)
Common symptoms → Hypotheses → Actions
The reported symptoms almost always concern Kubernetes, never etcd directly: a sluggish kubectl, Pods stuck in Pending, Deployments timing out. The link with etcd is confirmed or ruled out in a few commands.
Slow API server or timeouts
Three causes come up often, and each has its diagnostic command. Handle them in the order of the table: an active alarm blocks everything else and makes the other measurements impossible to interpret.
| Symptom | Likely cause | Diagnosis | Action |
|---|---|---|---|
| Pods pending for a long time | etcd in alarm mode | alarm list | Resolve the alarm (see runbook) |
| Slow kubectl requests | Overloaded etcd or slow disk | endpoint health --cluster: high took duration | Check disk I/O, consider SSDs |
context deadline exceeded | Unstable network between API server and etcd | etcd logs: slow request | Check network latency, MTU |
Frequent elections (unstable leader)
Every election interrupts writes: a few leader changes per hour are enough to make the API server erratic. The counter below only makes sense relative to the age of the Pod, since an old cluster has necessarily accumulated legitimate elections.
# Count the leader changes in the logskubectl logs -n kube-system etcd-etcd-lab-control-plane | grep -c "elected leader"| Cause | Solution |
|---|---|
| Network latency > 10ms | Improve the network or bring the nodes closer |
| Insufficient CPU | Increase the resources of the Pod/VM |
| Disk too slow | Migrate to NVMe SSD |
Latency runbook: where is the problem?
When etcd is slow, you need to identify where the latency sits:
-
Check the disk latency (metric
etcd_disk_backend_commit_duration_seconds)Terminal window # On the etcd nodeiostat -x 1 5Warning:
await > 10ms= disk too slow → migrate to NVMe SSD -
Check the network latency between peers (metric
etcd_network_peer_round_trip_time_seconds)Terminal window # From one etcd node to the othersping -c 10 <PEER_IP>Warning:
> 10ms= unstable network → check MTU, congestion -
Correlate with the etcd logs
Terminal window kubectl logs -n kube-system etcd-xxx --tail=200 | grep -E "took too long|slow"The messages indicate the type of slow operation (apply, commit, etc.)
Reading etcd logs usefully
etcd logs are voluminous and of no interest in day-to-day operations. Four patterns concentrate the useful information, and the filter below isolates them in one command.
kubectl logs -n kube-system etcd-etcd-lab-control-plane --tail=100 | grep -E "took too long|compact|alarm|elected leader"Each pattern has a precise meaning:
took too long: slow requests (I/O or network)compaction: compaction in progressalarm: quota reachedelected leader: leader change
Why back up etcd?
An etcd snapshot is the only copy that lets you rebuild a cluster whose control plane is lost: it contains all the Kubernetes objects, Secrets included, and must therefore be treated as sensitive data, stored outside the cluster. The frequency of your snapshots sets the maximum acceptable data loss, and a snapshot never restored does not prove that you know how to go back. Taking, verifying and restoring a snapshot with etcdctl and etcdutl, then building a backup strategy, is the subject of the Back up and restore lesson. The official documentation Operating etcd clusters for Kubernetes describes the same approach from the Kubernetes side.
Day-2 maintenance: compaction, defrag, quota
Without intervention, an etcd database only grows until it hits its quota and blocks the cluster. Two distinct operations prevent this, and the order matters: compaction removes the history that has become useless, defragmentation gives the freed space back to the file system. The quota is the safeguard that triggers the alarm when these two gestures have been neglected. The etcd project details these operations in its etcd Maintenance page.
Compaction
Compaction removes the old revisions to limit the growth of the database. It is irreversible: after compaction at revision N, no historical read earlier than N is possible any more, which interrupts the watches still attached to those revisions. In practice, this does not bother Kubernetes, whose controllers resynchronize automatically.
-
Get the current revision
Terminal window REV=$(etcdctl endpoint status -w json | grep -o '"revision":[0-9]*' | head -1 | cut -d: -f2)echo "Current revision: $REV"Expected output:
Current revision: 713 -
Compact up to this revision
Terminal window etcdctl compact $REVExpected output:
compacted revision 713
etcd can compact automatically. Configure it in the startup arguments:
# Periodic mode: compacts every hour--auto-compaction-mode=periodic--auto-compaction-retention=1h
# Revision mode: keeps the last N revisions--auto-compaction-mode=revision--auto-compaction-retention=10000
Defragmentation
Compaction marks data as deleted, but does not free disk space. Defragmentation reclaims that space.
# Defragment a single member (etcd must be running)etcdctl defrag --endpoints=https://127.0.0.1:2379Expected output:
Finished defragmenting etcd member[https://127.0.0.1:2379]. took 25.969208msTo defragment a stopped etcd (offline maintenance):
# Stop etcd, then:etcdutl defrag --data-dir /var/lib/etcdThe offline variant is used in two cases: reclaiming a lot of space at once before restarting a member, and taking advantage of a maintenance window that is already planned. On a running cluster, prefer the online form, member by member.
Recommended procedure (online):
- Defragment a follower
- Check its health (
endpoint health) - Defragment the next follower
- Defragment the leader last
Measuring what defragmentation reclaims
The value of the operation can be measured, and the PERCENTAGE NOT IN USE column
gives it directly. Here is the state of two lab members after a compaction,
but with defragmentation run on only one of them:
│ ENDPOINT │ DB SIZE │ IN USE │ PERCENTAGE NOT IN USE │ IS LEADER ││ https://172.26.0.6:2379 │ 2.1 MB │ 741 kB │ 65% │ false ││ https://172.26.0.7:2379 │ 684 kB │ 684 kB │ 0% │ true │Both members hold exactly the same data, Raft takes care of that. Yet the defragmented member takes 684 kB against 2.1 MB for the other, 65% of which is dead space. Two lessons. Compaction alone gives nothing back to the disk, it merely marks revisions as useless. And defragmentation works member by member: a cluster where only one member has been processed stays unbalanced until you go through the others.
It is also the measurement that lets you decide. Below a few percent, defragmenting gains nothing and costs a write interruption. Beyond several tens of percent, the operation is justified.
Quota and NOSPACE alarm
By default, etcd applies a quota of 2 GiB, that is 2,147,483,648 bytes (the QUOTA column shows it rounded, 2.1 GB). A --quota-backend-bytes option in the etcd Pod manifest, /etc/kubernetes/manifests/etcd.yaml on kubeadm, overrides this value. When the quota is reached:
- etcd triggers the
NOSPACEalarm - Only reads and deletions are allowed
- The Kubernetes cluster is blocked
Resolution runbook:
-
Check the alarm
Terminal window etcdctl --endpoints=https://127.0.0.1:2379 alarm listmemberID:4c95f7dc5897214a alarm:NOSPACE -
Compact the database
Terminal window # Get the current revision (robust JSON parsing if jq is available)REV=$(etcdctl --endpoints=https://127.0.0.1:2379 endpoint status --write-out=json | \grep -o '"revision":[0-9]*' | head -1 | cut -d: -f2)echo "Compacting up to revision: $REV"etcdctl --endpoints=https://127.0.0.1:2379 compact $REV -
Defragment all members (one by one, starting with the followers)
Terminal window # Get the list of endpointsetcdctl --endpoints=https://127.0.0.1:2379 member list --write-out=table# Defragment each member individuallyetcdctl defrag --endpoints=https://<FOLLOWER_1_IP>:2379etcdctl defrag --endpoints=https://<FOLLOWER_2_IP>:2379etcdctl defrag --endpoints=https://<LEADER_IP>:2379 # Last -
Disarm the alarm
Terminal window etcdctl --endpoints=https://127.0.0.1:2379 alarm disarm -
Check that the alarm is cleared
Terminal window etcdctl --endpoints=https://127.0.0.1:2379 alarm list# (empty output = OK)
Security: TLS first, access control second
etcd knows neither namespaces, nor ServiceAccounts, nor Kubernetes RBAC: whoever accesses the database accesses the whole cluster, including the Secrets stored in clear text if encryption at rest is not enabled. The priority is therefore to close network access and enforce certificate authentication, before even talking about fine-grained rights.
Mandatory mTLS
etcd must never be exposed without TLS. All communications must be encrypted:
| Communication | Ports | Certificates required |
|---|---|---|
| Client → etcd | 2379 | ca.crt, server.crt, server.key |
| etcd → etcd (peers) | 2380 | peer.crt, peer.key |
etcd RBAC (advanced cases)
For external or shared etcd clusters, you can enable authentication. This mechanism of users and roles internal to etcd has nothing to do with Kubernetes RBAC: it splits rights by key prefix, not by resource or by namespace. On an etcd dedicated to a single Kubernetes cluster, it brings nothing more than mTLS and complicates the renewal of access:
# Enable authenticationetcdctl auth enable
# Create a useretcdctl user add admin --new-user-password="***"
# Create a roleetcdctl role add readwriteetcdctl role grant-permission readwrite readwrite /
# Assign the role to the useretcdctl user grant-role admin readwrite
Monitoring and alerting
etcd incidents are almost always announced: the disk latency drifts, the database approaches the quota, the leader changes more often. Watching the right metrics turns a control plane outage into a simple planned maintenance operation. You still have to alert on the right signals and with thresholds calibrated to your hardware. The etcd Monitoring page of the project describes all the metrics.
Prometheus metrics
etcd exposes its metrics on /metrics (port 2379 with TLS). The key metrics to watch:
| Metric | Description | Initial threshold | Notes |
|---|---|---|---|
etcd_server_has_leader | Presence of a leader | != 1 | Critical, immediate action |
etcd_server_leader_changes_seen_total | Leader changes | > 3/hour | Adjust if the network is unstable |
etcd_disk_backend_commit_duration_seconds | Disk write latency | p99 > 25ms | On NVMe SSD, expect < 10ms |
etcd_network_peer_round_trip_time_seconds | Network latency between peers | p99 > 50ms | Depends on the distance between nodes |
etcd_mvcc_db_total_size_in_bytes | Database size | > 80% of the quota | Warning at 80%, critical at 95% |
etcd_server_proposals_failed_total | Failed Raft proposals | > 0 | Any failure = investigate |
These values are starting points, not truths. An alert threshold copied from a guide produces either noise or silence. Observe the trends of your own cluster over seven to thirty days, then set the thresholds from what you see and from the service commitment you have to meet.
PrometheusRule example
These three alerts cover the real emergencies: no leader, disk too slow, quota about to be reached. The for field avoids false positives by requiring the condition to last, and it is deliberately short for the missing leader, which must never persist beyond one minute. The PrometheusRule object assumes the Prometheus operator is installed.
apiVersion: monitoring.coreos.com/v1kind: PrometheusRulemetadata:  name: etcd-alerts  namespace: monitoringspec:  groups:  - name: etcd    rules:    - alert: EtcdNoLeader      expr: etcd_server_has_leader == 0      for: 1m      labels:        severity: critical      annotations:        summary: "etcd has no leader"
    - alert: EtcdHighDiskLatency      expr: histogram_quantile(0.99, rate(etcd_disk_backend_commit_duration_seconds_bucket[5m])) > 0.025      for: 5m      labels:        severity: warning      annotations:        summary: "High etcd disk latency (> 25ms)"
    - alert: EtcdDatabaseSpaceExceeded      expr: etcd_mvcc_db_total_size_in_bytes / etcd_server_quota_backend_bytes > 0.8      for: 5m      labels:        severity: warning      annotations:        summary: "etcd database close to the quota (> 80%)"
etcdctl cheat sheet
This summary gathers the commands of the guide in a copyable form. The ETCDCTL_CACERT, ETCDCTL_CERT and ETCDCTL_KEY variables replace the --cacert, --cert and --key options: exporting them once shortens all the following commands.
These commands run on the node, with an etcdctl installed on the
machine, and not in the distroless container. Install it from the
official archive of the etcd project, verifying its checksum, and not from your
distribution's package: the Back up and restore lesson
gives the commands. In this context, environment variables can be used again and
spare you from repeating the paths:
export ETCDCTL_CACERT=/etc/kubernetes/pki/etcd/ca.crtexport ETCDCTL_CERT=/etc/kubernetes/pki/etcd/healthcheck-client.crtexport ETCDCTL_KEY=/etc/kubernetes/pki/etcd/healthcheck-client.keyHealth and status
These four commands change nothing and are safe in production. The --cluster option widens the question to all members from a single reachable endpoint.
# Health of one endpointetcdctl --endpoints=https://127.0.0.1:2379 endpoint health
# Health of the whole clusteretcdctl --endpoints=https://127.0.0.1:2379 endpoint health --cluster
# Detailed status (leader, size, index)etcdctl --endpoints=https://127.0.0.1:2379 endpoint status --cluster --write-out=table
# List of membersetcdctl --endpoints=https://127.0.0.1:2379 member list --write-out=table
Maintenance
Defragmentation targets a specific endpoint, never the whole cluster: it is the only command on this page that you must run member by member, ending with the leader.
# Compact up to revision Netcdctl --endpoints=https://127.0.0.1:2379 compact <revision>
# Defragment one member (online)etcdctl defrag --endpoints=https://<IP>:2379
# Defragment offline (etcd stopped)etcdutl defrag --data-dir /var/lib/etcd
# List the alarmsetcdctl --endpoints=https://127.0.0.1:2379 alarm list
# Disarm the alarmsetcdctl --endpoints=https://127.0.0.1:2379 alarm disarm
Data (debug only)
Reading etcd keys directly bypasses the API server, hence all the access and audit controls of Kubernetes; the values are serialized in protobuf and hard to read. Reserve these commands for diagnosis, on a test cluster, and never write to etcd by hand.
# List all keys (WARNING: a lot of output)etcdctl --endpoints=https://127.0.0.1:2379 get "" --prefix --keys-only | head -20
# Read a specific keyetcdctl --endpoints=https://127.0.0.1:2379 get /registry/pods/default/my-pod
# Count the keysetcdctl --endpoints=https://127.0.0.1:2379 get "" --prefix --keys-only | wc -l
Runbooks "symptom → diagnosis → action"
These four procedures are followed during an incident, without prior thought. Each starts from an observable symptom, confirms the hypothesis with a command, then applies the fix in an order that does not make the situation worse. Keep them accessible outside the cluster: an unavailable control plane often makes the internal documentation unreachable along with it.
The commands in this section assume an etcdctl installed on the node
and the certificates already configured, as indicated just above.
NOSPACE alarm
The cluster no longer accepts any write as long as the alarm is armed, and it does not clear by itself: disarming is mandatory, even after freeing space. The full procedure (alarm list, compaction, member-by-member defragmentation, alarm disarm) is that of the Quota and NOSPACE alarm section. To check the result, run endpoint status --cluster --write-out=table again: the DB SIZE column must have decreased.
Loss of quorum
Below the quorum, etcd refuses any write: the cluster can no longer change state, and the API can become outright unavailable, with no "read-only" mode to count on, as measured in the Control plane high availability lesson. The switch is abrupt: on three members, losing the second one takes you from a degraded but working cluster to an unusable one.
- Identify the members that are down:
etcdctl --endpoints=https://127.0.0.1:2379 member list --write-out=table - If only 1 member out of 3 is down: wait for it to come back or replace it
- If 2 or more members are down: the quorum is lost. First try to restart them (machine, disk, network): if their data is intact, they rejoin the cluster and the quorum comes back, without any restore. If their data is lost, restoring from a snapshot with
etcdutl snapshot restorebecomes the only way out, a procedure detailed in the Back up and restore lesson
Slow etcd (I/O)
Every etcd write waits for a synchronized disk write on the majority of members: storage latency therefore directly affects that of the API server. This runbook is used to tell a disk problem from a network problem.
etcdctl --endpoints=https://127.0.0.1:2379 endpoint health --cluster→ note thetookduration of each member- Logs:
kubectl logs -n kube-system etcd-xxx | grep "slow\|took too long" - Check the IOPS of the disk:
iostat -x 1 - Check the network latency:
ping <PEER_IP>, which must stay under 10 ms - Fix: migrate to an NVMe SSD, improve the network
Expired certificates
The etcd certificates generated by kubeadm are valid for one year. On a cluster that has never been upgraded, they expire silently and the control plane goes down all at once, without any apparent configuration change.
The typical symptom is the transport: authentication handshake failed error. On the API server side, it often comes from apiserver-etcd-client, the client certificate the API server presents to etcd: it expires at the same time as etcd's. To confirm, then fix:
-
Check the expiration:
sudo openssl x509 -in /etc/kubernetes/pki/etcd/server.crt -noout -dates, then the same command on/etc/kubernetes/pki/apiserver-etcd-client.crt -
Renew with kubeadm:
sudo kubeadm certs renew etcd-server,sudo kubeadm certs renew etcd-peerandsudo kubeadm certs renew apiserver-etcd-client, orsudo kubeadm certs renew allto renew everything at once -
Make etcd reload its certificates: the serving certificate reloads by itself; for the others, nothing guarantees it.
A measurement of 13 November 2026 (kubeadm 1.37.2) shows that after
kubeadm certs renew etcd-server, etcd served the new serving certificate on port 2379 in under 25 seconds, without a restart or a new container. This measurement covers neitheretcd-peer, the certificate for exchanges between members, nor client certificates such asapiserver-etcd-client. The kubeadm documentation asks you to restart the control plane Pods after a renewal: so restart the etcd Pod by moving its manifest out of/etc/kubernetes/manifests/and putting it back. The Renewing certificates section of the kubeadm lesson shows this restart step by step. -
Restart the kube-apiserver, the controller-manager and the scheduler: the API server must reread
apiserver-etcd-client, and the other two only read the client certificate of their kubeconfig at startup. Move their manifests out of/etc/kubernetes/manifests/one by one, wait untilsudo crictl psno longer shows the container, then put the manifest back. Plan for an API outage of about 41 seconds for the four restarts (measurement of 13 November 2026, kubeadm 1.37.2). The Renewing certificates section of the kubeadm lesson details this gesture -
Copy
admin.confto~/.kube/config: this file carries an expired client certificate, andkubectlkeeps failing afterrenew alluntil it is replaced. Runsudo cp /etc/kubernetes/admin.conf $HOME/.kube/configthensudo chown $(id -u):$(id -g) $HOME/.kube/config, as in the Renewing certificates section of the kubeadm lesson
Pre-production checklist
These eight points are the ones whose absence turns an ordinary incident into a lost cluster. The first two take precedence over all the others: without a backup restored at least once and without an alert on the presence of a leader, the rest will not save you.
- Automated backups, tested (successful restore)
- Monitoring: alerts on leader, latency, disk space
- SSD: storage with latency < 10ms
- Network: latency < 10ms between etcd members
- TLS: mTLS enabled for clients and peers
- Quota: configured and monitored
- Maintenance: auto compaction + scheduled defrag
- Documentation: runbooks accessible to the team
Hands-on practice
The lab replays these gestures on a kubeadm cluster in virtual machines, where etcd runs in a static Pod (a Pod that the kubelet starts from a manifest) whose image contains etcdctl. With etcdctl and the etcd certificates, you read the member ID, its client endpoint and its health, then the space quota this etcd applies, in bytes. You record these answers in the ~/etcd/reponses.yaml file.
The setup then inflated the database and compacted it: it keeps a large, almost empty file. You defragment it so that it gives that space back. The validation covers three states: the answers match what etcd says about itself, the quota is the one the Pod really applies (its option, or the default value), and the database has given back at least half of the size it had after the inflation.
Key takeaways
- Three members protect against a machine failure, not against a slow disk, an unstable network or a quota reached: these causes hit all members at once.
- An etcd cluster has three or five members: an even number brings nothing, and beyond five every write gets slower.
- Storage must be an SSD, because a slow disk slows every write, hence the API server.
- A backup is only worth something if its restore has been tested: the procedure is in the Back up and restore lesson.
- Compaction then defragmentation prevent the
NOSPACEalarm; defragmentation is done member by member, leader last. - An etcd exposed without mTLS, for clients as well as for peers, puts the whole cluster at risk.
Test your knowledge
This quiz covers the etcd questions from the CKA certification curriculum. A score below 80% points to the sections to reread.
Knowledge check
Check what you have learned with this interactive quiz
How it works
- The timer starts when you click Start
- Multiple choice, true/false and short answer questions
- You can move between questions
- Detailed results are shown at the end
Starts the quiz and the timer
Review
(0/0)Score by domain
A domain groups several guides and gets several questions, so its score is more reliable than a per-topic score, which often rests on a single question.
Summary
Strengths
No topic passed at 80% on at least two questions yet.
Weak areas
No topic below the pass mark.
Recommended next
Hints before you try again?
Continue the course: Back up and restore Kubernetes
A new full quiz with random questions
Work again only on the questions you missed