CrashLoopBackOff means that a container crashes, restarts, then crashes
again in a loop. The first restart is immediate, then the kubelet waits 10 s, 20 s, 40 s,
and so on up to 5 min at most, to avoid overloading the node.
This guide gives you a 4-step method to identify the cause
and fix the problem.
What you will learn
- Understand the exponential backoff mechanism and why Kubernetes increases the delay between restarts
- Identify the six common causes of a CrashLoopBackOff
- Apply a repeatable diagnostic method in 4 steps
- Use
kubectl logs --previousandkubectl describe podto find the real cause - Reproduce and fix a CrashLoopBackOff on a test cluster
Prerequisites
- A working Kubernetes cluster (the lesson is written for 1.37)
kubectlconfigured and connected to the cluster- Read rights on pods, events and logs
- Basic knowledge of Pods and probes
What is a CrashLoopBackOff?
CrashLoopBackOff is not a Pod phase. It is a waiting state
visible in the STATUS column of kubectl get pods when a container
fails then restarts in a loop with backoff. The phase of the Pod may very well
stay Running during this time, and the status only shows during
the wait between two attempts: what matters is that the container
restarts in a loop.
The exponential backoff
When a container crashes, the kubelet applies a growing delay before each new restart:
| Restart | Wait before this restart | Time elapsed since the first restart |
|---|---|---|
| 1st | immediate | 0 s |
| 2nd | 10 seconds | 10 s |
| 3rd | 20 seconds | 30 s |
| 4th | 40 seconds | 1 min 10 s |
| 5th | 80 seconds | 2 min 30 s |
| 6th | 160 seconds | 5 min 10 s |
| 7th and following | 300 seconds (maximum) | +5 min per restart |
If the container runs 10 minutes without crashing, the backoff counter is reset to zero.
These values are those of a default cluster. Since Kubernetes 1.35, an
administrator can lower the 5-minute ceiling through
crashLoopBackOff.maxContainerRestartPeriod in the kubelet configuration.
If the delays you observe do not match the table, this is the
first thing to check with the team that operates the cluster.
What are the six common causes of a CrashLoopBackOff?
Here are six common causes, with the symptom that gives them away and the place to look:
| # | Cause | Typical symptom | Where to look |
|---|---|---|---|
| 1 | Application error | Exception, panic, segfault in the logs | kubectl logs |
| 2 | Missing configuration | Env variable absent, config file not found | kubectl describe pod (env, volumes) |
| 3 | OOMKilled | The container exceeds its memory limit | kubectl describe pod → Last State: OOMKilled |
| 4 | Misconfigured probe (liveness or startup) | Unhealthy, Killing, repeated restarts | kubectl describe pod → Events, probe definition |
| 5 | Invalid command or entrypoint | The container stops immediately, in StartError or with exit code 126/127 | kubectl describe pod, kubectl logs --previous |
| 6 | Unavailable external dependency | The database or the API cannot be reached | kubectl logs (timeout, connection refused) |
Four-step diagnostic method
-
Identify the pod in CrashLoopBackOff
List the pods and spot those whose STATUS is
CrashLoopBackOffor whoseRESTARTScounter is growing:Terminal window kubectl get pods -A | grep -E 'CrashLoop|Error|BackOff'Note the pod name, its namespace and the number of RESTARTS.
-
Read the logs of the crashed container
The command to run first is
kubectl logs --previous, which prints the logs of the previous run (the one that crashed):Terminal window kubectl logs <pod> -n <namespace> --previousIf the pod contains several containers, specify the container:
Terminal window kubectl logs <pod> -n <namespace> -c <container> --previousLook for clues:
Exception,Error,panic,Traceback,connection refused,OOM,permission denied. -
Inspect the description of the pod
Terminal window kubectl describe pod <pod> -n <namespace>The sections to look at first:
- Last State: the reason for the previous stop (
OOMKilled,Error,Completed) - Exit Code:
0= normal stop,1= application error,137= OOMKilled or SIGKILL,139= segfault,128= the container did not even start - Events:
Unhealthy(failed probe),BackOff,Pulling - Containers → Args/Command: is the start command correct?
- Containers → Env: are the environment variables present?
- Containers → Mounts: are the volumes mounted correctly?
- Last State: the reason for the previous stop (
-
Fix and check
Depending on the cause identified:
Cause Corrective action Application error Fix the code or the config, redeploy Missing config Add the ConfigMap/Secret, check the names OOMKilled Increase resources.limits.memoryMisconfigured probe Increase initialDelaySeconds,timeoutSeconds, or add a startup probeInvalid command/entrypoint Check command:andargs:in the manifestExternal dependency Check connectivity, add an init container After the fix, check that the pod is stable:
Terminal window kubectl get pods -n <namespace> -wThe
-wflag follows the evolution live. The Pod must go toRunning, and theRESTARTScounter must stop growing: this second condition proves the fix.
Practical example: reproduce a CrashLoopBackOff
To understand the mechanism well, deliberately create two Pods that crash for two different causes.
Case 1: application error (exit code 1)
kubectl apply -f- <<'EOF'apiVersion: v1kind: Podmetadata: name: crash-exit-error namespace: defaultspec: restartPolicy: Always containers: - name: app image: busybox:1.37@sha256:bdf57e528e45e4433820e045b29b4597825a1c9e38353532d90a01445013f82e command: ["sh", "-c", "echo 'Application démarrée'; sleep 2; echo 'Erreur fatale!'; exit 1"]EOFThe two echo messages are in French: Application démarrée means "application started" and Erreur fatale! means "fatal error!".
Wait 30 seconds then observe:
kubectl get pods crash-exit-error -wYou will see the STATUS go from Running to Error then to
CrashLoopBackOff, with the RESTARTS counter growing.
Diagnosis:
# Logs of the run that crashedkubectl logs crash-exit-error --previous
# Description with exit codekubectl describe pod crash-exit-error | grep -A5 "Last State"
Case 2: OOMKilled (memory limit exceeded)
To trigger a real OOMKill, the container must allocate memory beyond its limit. A simple dd to /dev/null consumes CPU, not RAM. Here is an example that really allocates memory with one line of Python:
kubectl apply -f- <<'EOF'apiVersion: v1kind: Podmetadata: name: crash-oom namespace: defaultspec: restartPolicy: Always containers: - name: app image: python:3.13-slim@sha256:6771159cd4fa5d9bba1258caf0b82e6b73458c694d178ad97c5e925c2d0e1a91 command: ["python3", "-c", "data = []; [data.append('x' * 10**6) for _ in range(500)]"] resources: limits: memory: "50Mi"EOFThe Python script allocates blocks of 1 MB in a loop until it exceeds the 50 Mi limit, which triggers an OOMKill.
Diagnosis:
kubectl describe pod crash-oom | grep -A5 "Last State"You will see Reason: OOMKilled and Exit Code: 137.
Cleanup
A simple kubectl delete pod is enough, but it gives each Pod its graceful shutdown delay, 30 seconds by default. The two options below delete the Pods without this delay, and there is nothing dangerous about them here, because these Pods hold no data.
kubectl delete pod crash-exit-error crash-oom --force --grace-period=0The essential exit codes
Exit codes help you quickly identify the nature of the crash:
| Exit code | Meaning | Probable cause |
|---|---|---|
0 | Normal stop | The container ended on its own, with restartPolicy: Always it will be restarted |
1 | Generic error | Application bug, unhandled exception |
2 | Misuse of a shell command | Invalid command or argument in command: |
126 | Permission denied | A shell refused to run a non-executable file |
127 | Command not found | A shell did not find the requested binary |
128 | StartError | The container never started: the runtime failed, not a program |
137 | SIGKILL (128 + 9) | Process killed by SIGKILL, often an OOMKill, but not exclusively |
139 | SIGSEGV (128 + 11) | Segmentation fault in the application |
143 | SIGTERM (128 + 15) | Graceful stop requested by Kubernetes |
Special cases
Three situations produce a CrashLoopBackOff without the four-step method being enough, because the information you expect is not where you look for it: the logs are empty, the container works fine anyway, or the culprit is not the application container. Recognizing them saves you from rereading ten times an output that will never say anything.
The following diagram sums up the path. It starts from the logs of the previous run: as long as they are empty or silent, you go down one question at a time, and each "yes" tells you in which field to read the cause.
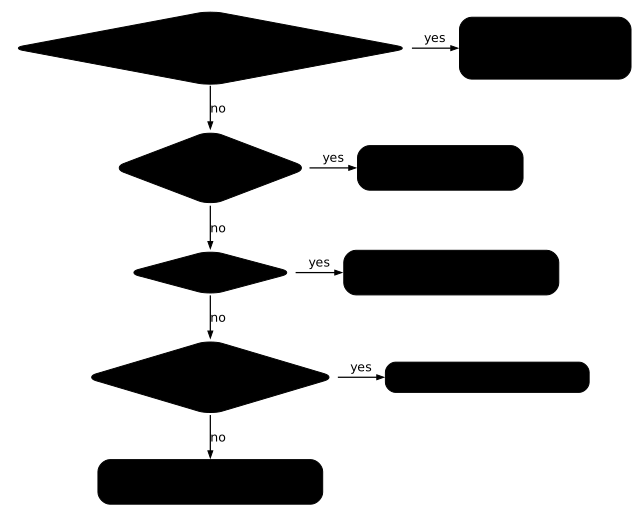
CrashLoopBackOff with empty logs
If kubectl logs --previous returns nothing, either the container crashed before producing anything, or it never started. The distinction is read in the exit code, and it completely changes the place to look.
Codes 126 and 127 come from a shell: they assume that a shell did
start, then did not find or could not run what you asked it.
The message is then in the logs.
kubectl logs mon-pod --previoussh: binaire-absent: not foundIn this example, mon-pod stands for "my pod", the name of your own Pod, and binaire-absent for "missing binary", the command the shell could not find.
When the manifest calls the binary directly, without a shell, there is
nobody to produce this message: the runtime fails to create the container, and
Kubernetes returns a StartError with exit code 128. The logs are then
permanently empty, and the cause lives in a field that few people think of
reading:
kubectl get pod mon-pod \ -o jsonpath='{.status.containerStatuses[0].state.terminated.message}'failed to create containerd task: failed to create shim task:OCI runtime create failed: runc create failed: unable to start container processRemember the rule: 126 or 127, look at the logs; 128, look at the
message. A 137 right at startup suggests an OOMKill, which kubectl describe pod confirms or not.
CrashLoopBackOff caused by a liveness probe
If the events show Unhealthy followed by Killing, the container
works but the liveness probe considers it dead:
Warning Unhealthy 10s kubelet Liveness probe failed: HTTP probe failed with statuscode: 503Normal Killing 10s kubelet Container app failed liveness probe, will be restartedThe solution is to review the probe configuration:
- Increase
initialDelaySecondsif the application takes time to start - Increase
timeoutSecondsif the endpoint is slow - Use a startup probe for long startups
See the guide on Kubernetes probes for configuration best practices.
CrashLoopBackOff on an init container
An init container runs once, before the main container. If it fails, the Pod never reaches Running, and the STATUS column shows Init:CrashLoopBackOff: the Init: prefix puts you on the track.
Same diagnosis, specifying the container:
kubectl logs <pod> -c <init-container> --previousQuick troubleshooting
This table is read from the left column, the one of the observed symptom. Each line gives the first action to take, the one that rules out or confirms a family of causes before going further. If none matches, go back to the four-step method rather than trying commands at random.
| Symptom | First action | Command |
|---|---|---|
CrashLoopBackOff with high RESTARTS | Read the previous logs | kubectl logs <pod> --previous |
| Exit code 137, no logs | Check the memory | kubectl describe pod <pod> → look for OOMKilled |
| Exit code 127 | Check the image and the command | kubectl describe pod <pod> → Containers section |
Unhealthy + Killing events | The probe kills the container | Review livenessProbe in the manifest |
Init:CrashLoopBackOff | The init container crashes | kubectl logs <pod> -c <init-container> --previous |
| Logs show "connection refused" | External dependency absent | Check the target Service/Endpoint |
Put it into practice
Two guided labs replay the same symptom. The first puts back into service a Deployment whose Pods restart in a loop since the last delivery: you read what the process said before dying, then you fix the Deployment itself. The validation reads the state of the Deployment and of its Pods: two replicas available, no more restart loop, the configuration variable at the right value, and an application that answers.
The second lines up three Pods and three distinct causes: a command that does not exist, a missing environment variable, a memory limit that is too low. You recreate each fixed Pod, and the validation reads the state of each one, its memory limit, and checks that the restart counter no longer grows.
Key takeaways
CrashLoopBackOffis not a Pod phase, it is a waiting state between two restarts, with a delay that doubles at each crash (first restart immediate, then 10 s, 20 s, 40 s... up to 5 min max)kubectl logs --previousis your main command: it prints the logs of the run that crashedkubectl describe podreveals the exit code, the events and the configuration, essential when the logs are empty- Exit code 137 = process killed by
SIGKILL, often an OOMKill (but not exclusively), check withkubectl describe podthen increaseresources.limits.memoryif it is confirmed - Exit code 127 = a shell did not find the binary, the message is
in the logs;
StartErrorand 128 = the container never started, the logs are empty and the cause is interminated.message - If the events show
Unhealthy→Killing, it is the liveness probe that kills the container, not an application crash - After the fix, watch the pod with
kubectl get pods -wand check that RESTARTS do not start again
Knowledge check
Seven questions to check three reflexes: telling a phase from a waiting state, knowing which field to read the cause in when the logs are empty, and recognizing the signature of an overly aggressive liveness probe.
Knowledge check
Check what you have learned with this interactive quiz
How it works
- The timer starts when you click Start
- Multiple choice, true/false and short answer questions
- You can move between questions
- Detailed results are shown at the end
Starts the quiz and the timer
Review
(0/0)Score by domain
A domain groups several guides and gets several questions, so its score is more reliable than a per-topic score, which often rests on a single question.
Summary
Strengths
No topic passed at 80% on at least two questions yet.
Weak areas
No topic below the pass mark.
Recommended next
Hints before you try again?
Continue the course: Diagnose a Kubernetes Pending Pod
A new full quiz with random questions
Work again only on the questions you missed