In the lesson Kubernetes architecture, you followed a Pod from kubectl to the container and saw which component acts at each step. This lesson opens up the control plane, the set of components that decide the state of the cluster without running your applications. You will see what each one does, why only one of them touches the cluster database, and how the control loop keeps bringing the cluster back toward what you declared.
What you will learn
- State the role of
kube-apiserver,etcd,kube-schedulerandkube-controller-manager, and that of thecloud-controller-managerwhen it exists. - Explain why only the API Server reads and writes etcd.
- Describe the control loop of a controller using a ReplicaSet as the example.
- Find the control plane components in the
kube-systemnamespace of a kind cluster.
The prerequisites are the lesson Kubernetes architecture and the kind cluster demo created in First cluster. The outputs in this lesson come from it. The randomly generated Pod names (web-6d8c9555f7-76k8w) and the durations will be different on your machine. The ReplicaSet name, web-6d8c9555f7, should stay the same with the same pinned image.
Overview of the control plane
The control plane gathers four components that work together, plus an optional fifth one for cloud clusters. None of them launches an application container: their job is to record what you ask for, to decide where to place it and to correct gaps.
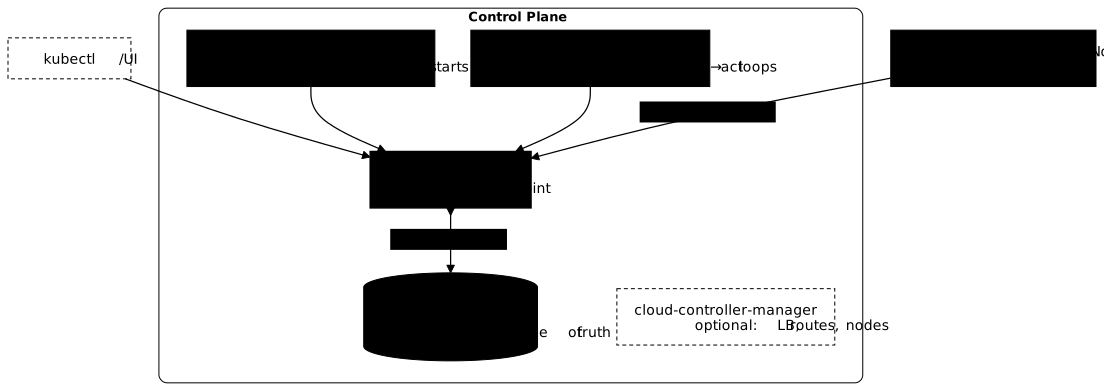
On the diagram, notice that all the arrows converge on kube-apiserver, and that etcd has a single link, with it. The table sums up what each component does, and above all what it does not do, because that is where confusion creeps in.
| Component | Its function | What it does not do |
|---|---|---|
kube-apiserver | single entry point, the only one to access etcd | does not launch containers |
etcd | key-value database, source of truth of the cluster | makes no decision |
kube-scheduler | assigns each Pod to a Node | does not start the container |
kube-controller-manager | reconciles the desired state and the actual state | does not talk to etcd directly |
cloud-controller-manager | (optional) drives the cloud provider's resources | does not exist on a local cluster |
On kind, the four native components run as Pods in the kube-system namespace. Find them:
kubectl get pods -n kube-system -l tier=control-planeNAME READY STATUS RESTARTS AGEetcd-demo-control-plane 1/1 Running 0 3m12skube-apiserver-demo-control-plane 1/1 Running 0 3m12skube-controller-manager-demo-control-plane 1/1 Running 0 3m12skube-scheduler-demo-control-plane 1/1 Running 0 3m12sThe four Pods are Running, and their name ends with the name of the Node that hosts them. On a managed cluster (EKS, GKE, AKS), this command returns nothing: the provider operates the control plane for you and does not expose it, which is not a failure.
These are static Pods: the kubelet of the control plane starts them itself from files placed on the Node, without going through the Scheduler. You can check this on the Scheduler's Pod: the annotation kubernetes.io/config.source: file indicates that it comes from a file on the Node, Controlled By designates the Node and not a ReplicaSet, and the Events section contains no Scheduled.
kubectl describe pod -n kube-system kube-scheduler-demo-control-planeName: kube-scheduler-demo-control-planeNode: demo-control-plane/172.18.0.4[...]Annotations: kubernetes.io/config.hash: 48eeb87484c93efa9c5ff2c64e47a429 kubernetes.io/config.mirror: 48eeb87484c93efa9c5ff2c64e47a429 kubernetes.io/config.seen: 2026-11-10T22:22:01.683806300Z kubernetes.io/config.source: file[...]Controlled By: Node/demo-control-plane[...]Events: Type Reason Age From Message ---- ------ ---- ---- ------- Normal Pulled 3m19s kubelet spec.containers{kube-scheduler}: Container image "registry.k8s.io/kube-scheduler:v1.37.0" already present on machine and can be accessed by the pod Normal Created 3m16s kubelet spec.containers{kube-scheduler}: Container created Normal Started 3m16s kubelet spec.containers{kube-scheduler}: Container startedThe three events come from the kubelet: it found the image, then created and started the container, and there is no Scheduled event. Troubleshooting a control plane component that no longer starts is covered at level 4, in cluster troubleshooting.
The API Server: the single entry point
The kube-apiserver receives all the requests of the cluster, whether they come from kubectl, a web dashboard, a CI/CD pipeline or another component of the cluster. No other component has a direct entry door.
What the API Server does
Its work comes down to three steps, always the same whatever the request. It validates the request (who sends it, are they allowed, is the manifest correct). It persists the state in etcd. It exposes this state through an HTTP API that any component can read back. This systematic validation is what makes it the guardian of the cluster.
The three everyday kubectl gestures, read, write and delete, are each a request sent to the API Server. The forms in the table are templates to adapt: <file> and <pod-name> are placeholders to replace with your file and the name of your Pod, they are not typed as is.
| Gesture | Command form |
|---|---|
| read | kubectl get pods |
| write | kubectl apply -f <file> |
| delete | kubectl delete pod <pod-name> |
Only the API Server accesses etcd
This is the central rule of the control plane: only the API Server communicates directly with etcd. The Scheduler, the Controller Manager and the kubelets all read and write through it. Three benefits follow: the data stays consistent since a single writer modifies it, a single component has to be protected to protect etcd, and the other components do not need to know etcd.
Check the state of the API Server
To know whether the API Server answers, query its health endpoints. This command works on any cluster, however it was installed:
kubectl get --raw /readyzokok means that the API Server is ready to handle requests. /livez and /healthz also answer ok on this cluster. With ?verbose, it details each check, including the one on etcd:
kubectl get --raw '/readyz?verbose'[+]ping ok[+]etcd ok[...]readyz check passedThe line [+]etcd ok shows that the API Server itself checks that it reaches etcd. If the API Server does not answer, the diagnostic approach is in cluster troubleshooting.
etcd: the source of truth of the cluster
etcd is a distributed key-value database that stores the whole state of the cluster. It is called the "source of truth": if a piece of information about the cluster differs between two places, the one in etcd prevails.
What etcd stores
Everything you can list with kubectl get is in etcd: Nodes, namespaces, Pods, Deployments, Services, ConfigMaps, Secrets, access rights, labels. It contains neither the logs of your containers, nor the metrics, nor the images.
A security point is worth remembering right away: by default, Secrets are not encrypted in etcd, they are only encoded in base64, which is not a protection. The Kubernetes documentation says it this way: "Kubernetes Secrets are, by default, stored unencrypted in the API server's underlying data store (etcd)". Encryption at rest is enabled explicitly, which the guide on Secrets explains.
Why etcd is critical
If etcd is lost without a backup, the cluster is unrecoverable: no more Deployments, no more Services, no more Secrets. On a managed cluster, the provider takes care of it; on a cluster you administer, backing it up is up to you. The procedure is in the etcd guide, and spreading etcd across several machines is in control plane high availability. On kind, a single etcd runs, in the etcd-demo-control-plane Pod seen above.
The Scheduler: choosing the Node
The kube-scheduler chooses which Node each new Pod goes on. It starts from the Pods that do not have a Node yet and returns, for each one, the name of a Node.
How the Scheduler works
It proceeds in two steps. Filtering discards the Nodes that cannot host the Pod: not enough CPU or memory, a taint the Pod does not tolerate (a mark placed on a Node to keep Pods away from it), a requested label that is missing. Scoring then ranks the remaining Nodes, for example by load spreading, and keeps the best one.
Each Pod names the scheduler that must place it in spec.schedulerName, default-scheduler by default: a Pod that names an absent scheduler stays Pending, even when the kube-scheduler Pod is Running.
What the Scheduler does not do
The Scheduler starts no container. It only writes the Node name into the Pod's spec.nodeName field, through the API Server. Then the kubelet of that Node sees an assigned Pod and starts it.
You can prove it with a Pod that no Node can host. This manifest requires a label disque: nvme (disque is French for disk) that no Node of demo carries:
apiVersion: v1kind: Podmetadata: name: disque-nvmespec: nodeSelector: disque: nvme containers: - name: web image: nginx:1.30@sha256:9bf97bd7714f5e24c1ccd545ecb9eb5435cb6d109c97cebb15e7e455e0239edbkubectl apply -f disque-nvme.yamlpod/disque-nvme createdWait a few seconds, then read the Pod. Right after the apply, the event has just been written (its Age shows one second) and the read can miss it:
kubectl describe pod disque-nvmeName: disque-nvme[...]Node: <none>[...]Status: Pending[...] Type Status PodScheduled False[...]Node-Selectors: disque=nvme[...]Events: Type Reason Age From Message ---- ------ ---- ---- ------- Warning FailedScheduling 11s default-scheduler 0/4 nodes are available: 1 node(s) had untolerated taint(s), 3 node(s) didn't match Pod's node affinity/selector. preemption: 0/4 nodes are available: 4 Preemption is not helpful for scheduling.The Pod stays Pending and Node is <none>: the Scheduler wrote no Node, so no kubelet has a container to start. The PodScheduled condition is False, and the reason is read in the events. The message says how many Nodes were discarded and why: the control plane because of its taint, the three workers because the nodeSelector (disque=nvme) matches none of them. Faced with a Pending Pod, read these events first.
The opposite case exists too: a Pending Pod whose Events section is empty, with neither Scheduled nor FailedScheduling, was examined by no scheduler, for example because the Scheduler is stopped, or because its spec.schedulerName designates an absent scheduler. So first check that the kube-scheduler Pod is Running. Now delete the test Pod with kubectl delete pod disque-nvme.
Scheduler communication
The Scheduler only talks to the API Server. It watches the Pods without a nodeName, computes the best Node for each one, and writes the result to the API Server, which persists it in etcd. It never contacts a kubelet or etcd.
The Controller Manager: the control loop
The kube-controller-manager is the component that makes Kubernetes self-correcting. It hosts several controllers, each responsible for one type of object, and each one constantly compares what you declared with what really exists.
The control loop: watch → compare → act
Each controller endlessly repeats the same three steps.
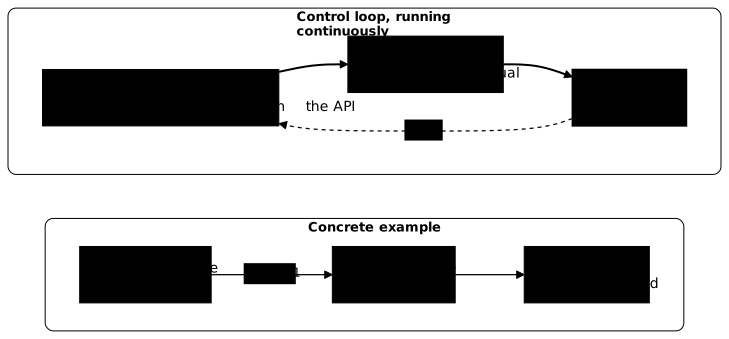
Read the diagram from left to right: the controller observes the state through the API Server (watch), compares it with the desired state (compare), and corrects the gap (act), then starts over. In the example at the bottom, three replicas are requested, two are observed, the gap is minus one, and the controller creates a Pod.
| Step | What the controller does | Example with a ReplicaSet |
|---|---|---|
| watch | observes the state through the API Server | "I see 2 Pods of the ReplicaSet" |
| compare | sets it against the desired state | "the ReplicaSet asks for 3" |
| act | creates or deletes objects to reduce the gap | "I create 1 Pod" |
This loop runs permanently, not only when someone types a command. A Pod that disappears at three in the morning is recreated without intervention. You can trigger it yourself by changing the desired state. Take the web Deployment from the lesson Kubernetes architecture (recreate it with its kubectl create deployment command if it no longer exists) and go from three to five replicas:
kubectl scale deployment web --replicas=5kubectl get pods -l app=web -o widedeployment.apps/web scaledNAME READY STATUS RESTARTS AGE IP NODE NOMINATED NODE READINESS GATESweb-6d8c9555f7-4cs6q 0/1 Pending 0 0s <none> <none> <none> <none>web-6d8c9555f7-76k8w 1/1 Running 0 2m39s 10.244.1.3 demo-worker3 <none> <none>web-6d8c9555f7-cm8pj 1/1 Running 0 2m55s 10.244.3.2 demo-worker2 <none> <none>web-6d8c9555f7-lz2gr 1/1 Running 0 2m55s 10.244.2.2 demo-worker <none> <none>web-6d8c9555f7-n7twf 0/1 Pending 0 0s <none> demo-worker3 <none> <none>You changed a single number, the desired state, and two Pods appeared: look at the lines whose AGE column is 0s. They are still Pending, the Scheduler has just seen them and one of them has already received its Node. Go back to three replicas, then read the events of the ReplicaSet (its name, web-6d8c9555f7, is computed from the Pod template):
kubectl scale deployment web --replicas=3kubectl describe rs web-6d8c9555f7 | sed -n '/^Events:/,$p'deployment.apps/web scaledEvents: Type Reason Age From Message ---- ------ ---- ---- ------- Normal SuccessfulCreate 2m55s replicaset-controller Created pod: web-6d8c9555f7-5bfjp Normal SuccessfulCreate 2m55s replicaset-controller Created pod: web-6d8c9555f7-lz2gr Normal SuccessfulCreate 2m55s replicaset-controller Created pod: web-6d8c9555f7-cm8pj Normal SuccessfulCreate 2m39s replicaset-controller Created pod: web-6d8c9555f7-76k8w Normal SuccessfulCreate 0s replicaset-controller Created pod: web-6d8c9555f7-n7twf Normal SuccessfulCreate 0s replicaset-controller Created pod: web-6d8c9555f7-4cs6q Normal SuccessfulDelete 0s replicaset-controller Deleted pod: web-6d8c9555f7-n7twf Normal SuccessfulDelete 0s replicaset-controller Deleted pod: web-6d8c9555f7-4cs6qRead the events in order. The first three SuccessfulCreate date from the creation of the Deployment, the fourth is the Pod recreated after the deletion in the previous lesson. The next two, dated 0s, are the scale-up to five: replicaset-controller saw three Pods for five requested and created two. The two SuccessfulDelete are the return to three: the same controller saw five Pods for three requested and deleted the two extra Pods.
The same loop plays out one level higher. Delete the ReplicaSet itself, then immediately read the state of the ReplicaSet and of the Pods:
kubectl delete rs web-6d8c9555f7kubectl get rs,pods -l app=webreplicaset.apps "web-6d8c9555f7" deleted from default namespaceNAME DESIRED CURRENT READY AGEreplicaset.apps/web-6d8c9555f7 3 0 0 0s
NAME READY STATUS RESTARTS AGE[...]pod/web-6d8c9555f7-76k8w 1/1 Terminating 0 2m39spod/web-6d8c9555f7-8czhv 0/1 Pending 0 0spod/web-6d8c9555f7-cm8pj 1/1 Terminating 0 2m55spod/web-6d8c9555f7-lz2gr 1/1 Terminating 0 2m55s[...]pod/web-6d8c9555f7-v2l4n 0/1 Pending 0 0spod/web-6d8c9555f7-x8j6s 0/1 Pending 0 0sRead the result in two parts. The three Pods that were running are Terminating (the [...] hide two Pods from the scale-up to five, which are also finishing their shutdown): they disappear with their ReplicaSet, because the garbage collector deletes objects whose owner no longer exists.
But a ReplicaSet web-6d8c9555f7 already exists again (AGE 0s, DESIRED 3), with three brand new Pods in Pending: the deployment-controller saw that a ReplicaSet was missing and recreated it, and that ReplicaSet recreated its Pods. It has the same name because this name comes from the Pod template, which did not change. Ten seconds later, everything is back:
kubectl get rs,pods -l app=webNAME DESIRED CURRENT READY AGEreplicaset.apps/web-6d8c9555f7 3 3 3 10s
NAME READY STATUS RESTARTS AGEpod/web-6d8c9555f7-8czhv 1/1 Running 0 10spod/web-6d8c9555f7-v2l4n 1/1 Running 0 10spod/web-6d8c9555f7-x8j6s 1/1 Running 0 10sThe events confirm who did what:
kubectl get events --sort-by=.lastTimestamp | tail -15[...]10s Normal SuccessfulCreate replicaset/web-6d8c9555f7 Created pod: web-6d8c9555f7-v2l4n[...]10s Normal Killing pod/web-6d8c9555f7-76k8w Stopping container nginx[...]SuccessfulCreate is the ReplicaSet creating a new Pod, and Killing the kubelet stopping the container of one of the old Pods. The Deployment controller, for its part, can be read on the Deployment, in the From column of its events:
kubectl describe deployment web | sed -n '/^Events:/,$p'Events: Type Reason Age From Message ---- ------ ---- ---- ------- Normal ScalingReplicaSet 11s (x2 over 3m6s) deployment-controller Scaled up replica set web-6d8c9555f7 from 0 to 3 Normal ScalingReplicaSet 11s deployment-controller Scaled up replica set web-6d8c9555f7 from 3 to 5 Normal ScalingReplicaSet 11s deployment-controller Scaled down replica set web-6d8c9555f7 from 5 to 3The From column gives the exact name of the component that acted, here deployment-controller. Look at the first line: (x2 over 3m6s) means that the same event occurred twice in three minutes. The recreated ReplicaSet has the same name, so the message Scaled up replica set web-6d8c9555f7 from 0 to 3 is identical to the one from creation, and Kubernetes aggregates it into a single line instead of displaying two. The next two lines are the scale-up to five then the return to three, also decided by the deployment-controller.
The grouped controllers
The Controller Manager groups several controllers in a single process. The most useful ones to know are the Deployment controller (it handles rolling updates and rollbacks), the ReplicaSet controller (it maintains the number of replicas), the Node controller (it detects Nodes that no longer answer) and the Job controller (it tracks the completion of a one-off task).
The Controller Manager does not touch etcd
Like any other component, it reads and writes through the API Server, never directly in etcd. It watches the API Server, compares, then asks the API Server to create or delete the objects it deems necessary.
The cloud-controller-manager (optional)
The cloud-controller-manager only exists on clusters deployed at a cloud provider (AWS, GCP, Azure). It creates in the cloud the resources the cluster needs: a load balancer for a Service, a network route, the handling of a deleted virtual machine.
When it is present
If your cluster has to create resources at a provider, it needs this component and the associated rights at the provider; otherwise, it is useless. On EKS, GKE or AKS, it is already there and you have nothing to do. On a cluster you install yourself in the cloud, deploying it is up to you. On kind, minikube or a kubeadm cluster without a cloud, it does not exist.
What it manages
It contains controllers specific to the cloud. The Node controller checks that a machine still exists at the provider, the route controller configures network routing, and the Service controller creates the load balancer when you declare a Service of type LoadBalancer.
Without it, a Service of type LoadBalancer has no external address. This is what you will see on kind: expose the web Deployment from the lesson Kubernetes architecture with a Service of this type, wait a few seconds, then read it:
kubectl expose deployment web --type=LoadBalancer --port=80 --name=web-lbkubectl get svc web-lbservice/web-lb exposedNAME TYPE CLUSTER-IP EXTERNAL-IP PORT(S) AGEweb-lb LoadBalancer 10.96.7.193 <pending> 80:30462/TCP 15sThe Service does get a CLUSTER-IP (its address inside the cluster) and a Node port (30462, open on every Node). Its EXTERNAL-IP, however, stays <pending>: nobody creates a load balancer, and the address does not arrive, even after fifteen seconds as here.
This behavior is normal on a local cluster. To reach the application, use a Service of type NodePort or the kubectl port-forward command. Delete the test Service with kubectl delete svc web-lb.
Communication between components: the pull model
Kubelets follow a pull model: they keep a connection open to the API Server to learn about their Pods, and the API Server does not open a connection to them to give orders. In the opposite model (push), the control plane would have to be able to reach every Node at all times.
What the pull model means
The practical consequence is resilience. If the control plane becomes unreachable, each kubelet keeps running the Pods it has already received. It simply can no longer receive new ones, nor replace a fallen Pod, since it is the control plane that decides to recreate it. How the kubelet works is detailed in Worker Nodes.
Traffic still goes the other way for a few specific gestures. kubectl logs, kubectl exec and kubectl port-forward go through a connection that the API Server opens to the kubelet, on port 10250. A firewall that blocked this port would let the cluster work, but would make these three commands unusable.
Put it into practice
The guided lab makes the control loop act before your eyes: you delete a Pod, then the ReplicaSet that owns it, and you record for each object the controller that recreated it. To find it, read the events as in the scaling example above: the From column names the controller. The lab works on the Deployment vitrine, with three replicas, in the namespace reconciliation, and you write your findings in ~/reconciliation/releve.txt. The validation compares your findings with what the cluster says.
Key takeaways
- The control plane combines
kube-apiserver,etcd,kube-schedulerandkube-controller-manager, plus thecloud-controller-manageron cloud clusters. - Only the API Server accesses etcd, all the other components go through it.
etcdis the source of truth: losing it without a backup means losing the cluster, and Secrets are not encrypted in it by default.- The Scheduler assigns a Node to a Pod, it starts no container: the kubelet does. A
PendingPod without aScheduledevent was placed by no scheduler. - A controller endlessly repeats observe, compare, act, which recreates a vanished Pod.
- The Controller Manager groups several controllers and also goes through the API Server.
- The cloud-controller-manager is optional, and without it a
LoadBalancerService stays<pending>. - The pull model keeps Pods running when the control plane is unreachable.
Knowledge check
The questions cover three points that invite confusion: who accesses etcd, who actually launches the containers, and in which direction communications flow.
Knowledge check
Check what you have learned with this interactive quiz
How it works
- The timer starts when you click Start
- Multiple choice, true/false and short answer questions
- You can move between questions
- Detailed results are shown at the end
Starts the quiz and the timer
Review
(0/0)Score by domain
A domain groups several guides and gets several questions, so its score is more reliable than a per-topic score, which often rests on a single question.
Summary
Strengths
No topic passed at 80% on at least two questions yet.
Weak areas
No topic below the pass mark.
Recommended next
Hints before you try again?
Continue the course: How Kubernetes worker nodes work
A new full quiz with random questions
Work again only on the questions you missed