Observing a published service means measuring what the client really received, then deciding from what gap you wake someone up. The entry point is the service that receives the clients' requests, most often a reverse proxy (a server placed in front of your applications, which receives requests in their place). This lesson is for someone who already publishes a service and wants to know whether that service is doing well. It teaches how to define a success indicator, to tune an alert, to link a request to its backend (the application that answers behind the proxy), and not to confuse silence with good health.
What you will learn
- Define a service level indicator as the client sees it: which requests count, which ones succeed.
- Tune the three thresholds of an alert from measurements, not from values picked at random.
- Tell a real failure, an absence of traffic and a lost collection apart.
- Link a failing request to its backend and its duration by an identifier.
- Prove that an alert fires on a real failure and returns to normal.
Prerequisites
This lesson assumes you can read an HTTP exchange, that you have already protected an entry point and that you handle a YAML file. It does not re-explain these gestures.
- Read an HTTP exchange: method, path, status code.
- Define an entry point security policy: know what the log must never contain.
- Know how to query a URL with
curl.
What does this lesson cover, and what does it leave to the other pages?
This lesson covers the traces the delivered service leaves at the entry point, and the decision that leads from the signal to the alert, without depending on a tool. The subject exists elsewhere on the site, from other angles, and the simplest is to say who does what.
The tool guides show how to obtain the signals: Observe Traefik with logs and metrics, Observe Nginx and Protect and observe HAProxy give the directives, the fields and the status points specific to each product. The lesson Observability in the architecture (in French) reasons at the level of a whole system: the signal pipeline, and the failure of observability itself. The page Cloud monitoring vs observability (in French) lays down the three pillars.
Here, we take the service as seen from the entry: which indicator to keep, how to write it as a precise definition, from what gap it is serious. The theory of objectives and the error budget stays in SLI, SLO and error budget (in French), which is not repeated.
What does the entry point see that the application does not?
The entry point sees every request arrive, including those that never reach the application, and that is what makes it the best observation post for the service delivered. The application only knows the requests it received and processed. The proxy also sees those it refuses itself, those that fail before arriving, and the total time spent end to end.
Four things are specific to it. The refusal it pronounces on its own (a forbidden access, a rate limit reached) does not appear in the application's log, which never receives the request. The connection failure to the backend, which it turns into an error for the client, neither, for the same reason. This is not a magical property of the proxy: if another stage logs upstream, or if the application applies an access control itself, the split changes. The total duration includes the wait before the application starts, which the application does not measure. Finally, for each request, it knows the state returned to the client, the only one that matters to the user.
A trap follows, established by the lesson Timeouts, retries and caching: a replay (sending a failed request to another backend) can hide the failure from the client. The first attempt fails, the second succeeds, and the client receives a success. The errors seen by the client therefore do not measure the backend's real health. That is why we observe at the entry point: only it sees each attempt to the backend, not just the final response, as the lesson Load balance a service and check its health details. In this lesson's lab, there is no replay: the route logs directly, and the measurement concerns what it answered.
What is an SLI, and what should it count?
An SLI (Service Level Indicator) is a proportion of successful requests among the requests that count, and all the work consists in writing these two words: "successful" and "count". Without this written definition, two people look at the same dashboard and do not talk about the same thing.
Take a shop with a /paiement route. The denominator (the total you divide by) gathers the business requests made by real customers to this route. The numerator (what you divide) keeps only those that succeeded. If 90 requests out of 100 succeed, the indicator is 0.9, that is 90%.
Three decisions are made in writing. The first is the route. The health route, called by supervision every few seconds, is never a business route: it almost always answers well, and it drowns the real requests in noise. If it enters the denominator, a service that fails one time in two looks healthy. The second is the success criterion: a range of HTTP status codes, for example from 200 to 299. The third is what to do with the 4xx family codes, which the client causes by asking for a missing page: the lab does not meet them, but an honest definition says whether they are counted, and why.
Here is the format of such a file for the /paiement route of another service. Each field answers a decision: route names the counted route, exclut lists what never enters the denominator, and the two bounds set the success.
route: /paiementexclut: - /santecode_min_succes: 200code_max_succes: 299Always check a definition on a known set before trusting it. If your log contains 10 business requests of which 5 fail, plus 10 successful health requests, a correct indicator is 0.5. If it shows 0.75, the health route has slipped into the denominator, and the gap is the flaw itself.
Availability is not always enough. Latency (the response time) is defined the same way: a proportion of requests faster than a threshold. Avoid the average, which hides the slow requests behind many fast ones; prefer a percentile, for example the 95th, the value that 95% of durations do not exceed. This lesson's lab only measures availability: latency serves here as a complement to read in the log.
How do you link a failing request to its backend and its duration?
You link a request to its backend by a unique identifier that the proxy assigns or passes on, and that each log writes on its line. Without this identifier, the on-call person (the one on duty) sees an error rate rise and does not know which request to look at. With it, they look up a line, read the code, the duration, the route, and know which backend answered.
This identifier is often called a request identifier. The client or the proxy writes it in an HTTP header, which the application copies into its own log. The tool guides show the exact directive, for example in Observe Nginx. The lab's log writes one JSON line per request, with the fields ts (the time), id, route, code, latence_ms and lot.
A correlation (putting side by side two records that speak of the same event) is written down. For the lab's already logged incident, the file carries four fields: the request identifier (requete_id), the backend that served it, the code returned and the duration (duree_ms). Here is the format, with the values of another incident.
requete_id: incident-a1b2c3backend: pub-obs-paiementcode: 503duree_ms: 412The backend's name is not written in the lab's log. Here, a single service serves the business route: it is the name of its system unit that you report. The general rule is to name the component that answered, not the one that relayed.
A rule of caution goes with the correlation: the identifier must stay harmless. An access token, a cookie or a password never belongs in a log line, as the entry point security policy recalls. Likewise, the identifier goes in the log, never in a metric label: each distinct value creates a series to store, and a unique identifier per request would multiply them without limit.
When does an alert deserve a wake-up call?
An alert deserves a wake-up call when a business indicator crosses a threshold that a failure exceeds and that calm does not exceed, over a duration long enough not to ring at every hiccup. An alert is a rule that compares a measurement to a threshold and warns someone when it crosses it. A rule that never rings protects nothing, a rule that rings all the time ends up ignored.
Three settings define the lab's alert, in a policy file reread continuously. Each has its trap, and each is set from a measurement of the healthy service, never from a guessed value.
The first is the error rate threshold. The error rate is the share of failing requests in a window, a number between 0 and 1. A threshold above 1 is out of reach: the alert will never fire. A zero threshold rings on the slightest isolated error, even permanently. The right threshold sits between the healthy service's rate and that of the injected failure.
The second is the minimum traffic volume. On ten requests, one error gives 10%, whereas on ten thousand it gives 0.01%: a rate computed on too few requests means nothing. This threshold sets the number of requests under which you refuse to conclude. Set too high, it makes normal traffic pass for an absence: you tune it from the healthy service's volume, which you observe first.
The third is the freshness of the collection, covered in the next section. The first two concern a sliding window, a recent interval that advances with the clock. In the lab, the exporter (the program that rereads the log and counts the requests) keeps the last 10 seconds. This window is also the alert's delay: it rings when the window is filled enough with errors, and does not resolve at the first success.
A useful alert comes with a runbook, a short sheet that says what to look at first and whom to warn. It rests on the on-call duty: its quality is judged by what that person understands when reading it at three in the morning. For the mechanics of alert rules, see the guide Alerting (in French).
How do you tell a failure, a quiet night and a blocked collection apart?
Silence has three causes that the dashboard confuses: a real failure, an absence of traffic and a lost collection, and the last two forbid concluding that everything is fine. The on-call person who opens an empty dashboard cannot say whether the night was good or whether nobody was watching. The only remedy is to teach the system to name each case.
A collection is the path that turns requests into measurements: the exporter rereads the log and publishes counters, which the evaluator queries. It can fall without the service falling. Its figures then stay frozen at their last value, and look normal. An evaluator that does not check their age announces a phantom health.
The diagram follows the order of the lab evaluator's questions. Note that the real failure is only reached after two positive answers: the collection is recent, and the traffic is sufficient. The two greyed boxes are cases where you conclude nothing.
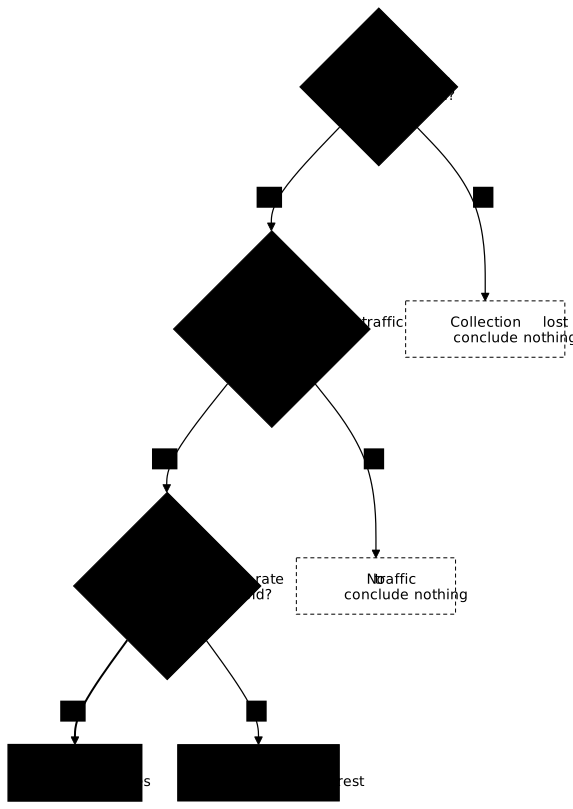
What makes the diagnosis reliable is that freshness and volume are checked before the error rate, and not the precise order of these two between themselves. If the error rate were computed first, a frozen collection would show a rate of 0 and we would say "all is well". If the volume were not checked, a night without customers would pass for a 100% success, or would cause a division by zero. The order retained here is that of the lab's evaluator; it is a reasonable design principle, not a law.
The first setting, the maximum freshness of the collection, sits between two bounds. It must exceed the exporter's refresh period, which you read by comparing two successive values of pub_obs_export_timestamp on its /metrics endpoint. It must stay short enough for an exporter frozen for a few seconds to be detected. The ten minutes of the starting setting would only report the loss well after the end of the incident.
The same reasoning holds for traffic: the absence of traffic is declared only if the window's volume falls under the minimum, and it can only fall under it if the minimum is above zero. The evaluator returns a JSON diagnostic at the address /diagnostic, with the fields classification, firing (is the alert ringing), taux_erreur and total_fenetre. Read it before tuning anything.
How do you prove an alert really works?
You prove an alert by causing the failure it must detect, waiting for it to ring, then repairing and waiting for it to go quiet. An alert that has never been seen ringing has only a theoretical value: the threshold may be out of reach, the window too long, the rule wrongly wired, and nothing says so until a real failure arrives.
The method comes down to four gestures. Measure first the nominal state: classification nominal, firing false, a traffic volume in the window. Cause then the failure: in the lab, placing the file /var/lib/pub-obs/panne makes the /commande route answer 500, and removing it repairs it. Wait for the length of the window, then read /diagnostic: the classification must change to panne_reelle with firing true. Repair, wait again, and check the return to false.
sudo touch /var/lib/pub-obs/pannecurl -s http://127.0.0.1:<port-evaluateur>/diagnosticsudo rm -f /var/lib/pub-obs/panneThe evaluator's port is given in /home/student/README-obs, because it is drawn at random at each preparation. After a few seconds of failure, the expected output is a JSON object whose classification is panne_reelle. If it stays nominal or absence_trafic after two windows, a threshold is misplaced.
The two other cases are caused the same way. For the absence of traffic, you stop the provided generator (systemctl stop pub-obs-generateur.service): the diagnostic must say absence_trafic, never panne_reelle, since no request fails. For the lost collection, you freeze the exporter with the SIGSTOP signal, which suspends a process without killing it, and the diagnostic must end up saying collecte_perdue. In both cases, you restore the original state afterwards, otherwise the dashboard stays mute.
Practice
In the lab, a business route runs on the edge.lab machine, behind a collection that works but whose policy is deliberately badly tuned. You write /home/student/sli.yaml, you fix /etc/pub-obs/politique.yaml so that the evaluator tells the three cases apart, and you write /home/student/correlation.yaml for the incident named in /home/student/README-obs.
The validation applies your sli.yaml to a known historical batch, which must give 10 requests of which 5 succeeded, then to a fresh batch of 10 business requests, 6 successful, plus 3 health requests that do not count. It compares your correlation with the real log line. Finally, it causes three situations: a failure classified panne_reelle with the alert active within 25 seconds then resolved within 25 seconds, a stopped generator that must give absence_trafic, and a frozen exporter that must give collecte_perdue. It also requires nominal when everything runs. Latency is not measured.
Key points
- The entry point sees every request, including those the application never sees, and every attempt to the backend.
- A replay can hide a failure from the client: the errors seen by the client do not measure the backend's real health.
- An SLI is a proportion of successes among the requests that count; the health route never enters it.
- A definition is checked on a known set before being believed.
- A request identifier links the proxy, the backend, the code and the duration, without ever carrying a secret.
- An error rate threshold above 1 never rings, a zero threshold rings all the time.
- The evaluator tests the freshness of the collection first, then the volume, then the error rate.
- Silence is not good news: absence of traffic and lost collection are two cases to name.
- An alert is proven by causing the failure, then repairing it.
Knowledge check
The quiz checks that you can define an indicator, tune an alert and read a silence without taking it for health.
Knowledge check
Check what you have learned with this interactive quiz
How it works
- The timer starts when you click Start
- Multiple choice, true/false and short answer questions
- You can move between questions
- Detailed results are shown at the end
Starts the quiz and the timer
Review
(0/0)Score by domain
A domain groups several guides and gets several questions, so its score is more reliable than a per-topic score, which often rests on a single question.
Summary
Strengths
No topic passed at 80% on at least two questions yet.
Weak areas
No topic below the pass mark.
Recommended next
Hints before you try again?
Continue the course: Prepare go-live, recovery and rollback
A new full quiz with random questions
Work again only on the questions you missed