Picture a common situation in large organisations: one team deploys 50 times a day with a 2 % failure rate, while another, deemed more "serious" because it takes its time, deploys only twice a month with a 35 % failure rate. Management still considers the first one risky and the second one exemplary.
This absurd situation reveals a fundamental problem: how do you objectively measure the performance of a software delivery team? Traditional metrics (lines of code, number of features, bugs fixed) are easy to game and do not reflect the real value delivered.
This page explains DORA metrics: their origin, what each one reveals, the associated performance levels and their recent evolution, the collection method, then a step-by-step improvement plan. It is for teams that want to replace intuition with data.
What you will learn
- Understand the origin and scope of DORA metrics.
- Distinguish the 4 historical metrics and what each one really reveals.
- Place your team on the performance scale and know its recent evolution.
- Set up tooled collection from CI/CD, incidents and monitoring.
- Prioritise an improvement plan on the main bottleneck.
- Avoid the most frequent measurement traps (gamification, mean versus median).
What is DORA?
DORA (DevOps Research and Assessment) is a research programme launched in 2014 by Nicole Forsgren, Jez Humble and Gene Kim. Their goal: identify through surveys and statistics what sets high-performing teams apart, rather than relying on opinions or fashions.
According to the DORA 2024 report, the research has surveyed more than 39,000 professionals over a decade, in organisations of every size and sector. The key metrics that came out of it have become the reference for measuring delivery performance, used by tools such as GitLab or Apache DevLake.
The programme is still active and evolving: its 2025 edition changed its name and its analysis method, a sign that the research keeps refining instead of freezing on a single model. The section on performance levels details this turning point.
What are the 4 DORA metrics?
The 4 historical metrics split into two complementary families: delivery speed (how fast an idea becomes code in production) and stability (how reliable your deployments are). The diagram sums up this split and the research's central finding.
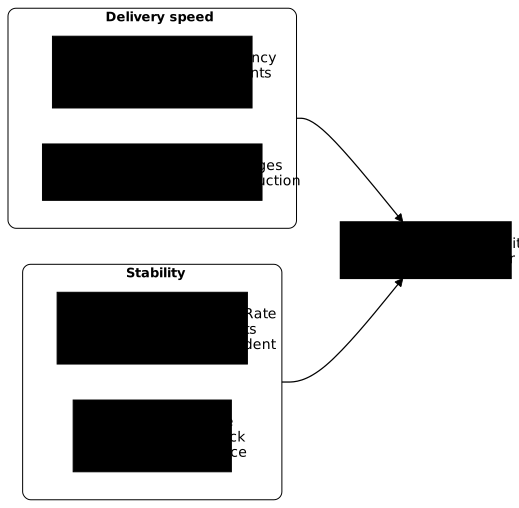
This speed and stability split is still the most taught. DORA's current model, presented at the end of the page, puts recovery time on the throughput side and adds a fifth indicator of instability: the core ideas do not change.
Deployment Frequency (DF)
Key question: how often does your organisation deploy code to production?
This metric measures the throughput of your delivery chain. A high frequency usually reflects small, incremental changes, an automated CI/CD pipeline and real confidence in the deployment process.
What DF really reveals
The following table links an observed deployment frequency to what it usually reveals about pipeline maturity and about the organisation running it. These are trends, not an automatic diagnosis.
| Frequency | What it indicates |
|---|---|
| Several times a day | Trunk-based development, feature flags, continuous deployment |
| Once a day to once a week | Good automation level, some manual processes |
| Once a week to once a month | Long-lived branches, manual tests, multiple approvals |
| Less than once a month | Silos, bureaucracy, fear of change |
Lead Time for Changes (LT)
Key question: how much time passes between the commit and the production deployment?
This metric measures the flow of your value chain. A short lead time means fast feedback on changes, fixes possible before problems pile up, and real responsiveness to urgent business requests.
The components of lead time
Lead time is not a single block: it breaks down into successive phases, each with its own causes of delay and its own levers. Value stream mapping helps measure each of these waits.
| Phase | Lengthening factors | Improvement actions |
|---|---|---|
| Code review | Overloaded team, merge requests too large | Limit change size, pair review |
| CI/CD | Slow tests, sequential builds | Parallelisation, cache, selective tests |
| Staging | Unstable environment, manual tests | Automated tests, infrastructure as code |
| Deployment | Release windows, approvals | Continuous deployment, feature flags |
Change Failure Rate (CFR)
Key question: what percentage of deployments causes an incident in production?
This metric measures the quality of your deployments. A low CFR usually reflects effective automated tests, serious code reviews and well-sized changes.
What is a "failure"?
For the metric to stay consistent over time, clearly define what counts as a failure, then stick to it. The table offers a starting convention common among practitioners, not an official definition from DORA.
| Included in CFR | Excluded from CFR |
|---|---|
| Rollback needed | Cosmetic bug with no impact |
| Emergency fix deployed within 24 h | Feature flag deliberately turned off |
| Incident created (P1, P2) | Infrastructure outage unrelated to the change |
| Performance degradation beyond the threshold | Planned improvement that reveals an existing bug |
The formula is simple: CFR = (deployments that caused an incident / total deployments) × 100. Example: out of 100 deployments this month, 8 needed a rollback or a fix, which gives a CFR of 8 %.
Time to Restore Service (MTTR)
Key question: how long does it take to restore service after a production incident?
This metric measures your organisation's resilience. A short restore time assumes fast detection (monitoring, alerts), a well-oiled incident process, the ability to roll back quickly and a blameless culture that encourages people to report problems.
In 2023, DORA renamed and redefined this metric as Failed Deployment Recovery Time, to limit it to outages caused by a deployment and isolate it from external infrastructure outages. The MTTR acronym remains the most widespread term in tools: this page uses it for consistency with that common vocabulary.
The phases of restoration
Like lead time, restore time breaks down into distinct phases. Knowing which one drags the most avoids investing in the wrong tool, for example improving runbooks when the real bottleneck is detection.
| Phase | Description | Optimisation |
|---|---|---|
| TTD (Time to Detect) | Time before anyone knows there is a problem | Synthetic monitoring, SLO-based alerts |
| TTAck (Time to Acknowledge) | Time before a human takes charge | Clear on-call rotation, automatic escalation |
| TTF (Time to Fix) | Diagnosis and fix time | Runbooks, observability, structured logs |
| TTDep (Time to Deploy) | Time to deploy the fix | Fast pipelines, automated rollback |
| TTVer (Time to Verify) | Confirmation that the incident is resolved | Smoke tests, post-deployment monitoring |
What are the DORA performance levels?
Until 2024, the annual report classified teams into 4 levels (Elite, High, Medium, Low) built by statistical clustering of the answers. This model remains the best entry point to place a team, even though DORA dropped it in 2025. The diagram shows the 2024 report values, detailed level by level below.

Elite level
This level is a long-term goal, not a realistic starting point for most teams. It mainly serves as a reference to picture what a mature delivery system makes possible, once the main manual brakes have been removed.
| Metric | Value (2024 report) |
|---|---|
| Deployment Frequency | On demand, several times a day |
| Lead Time for Changes | Less than one day |
| Change Failure Rate | Around 5 % |
| Time to Restore | Less than one hour |
Elite teams share a few recurring traits: trunk-based development with feature flags, reliable automated tests on critical paths, continuous deployment with no manual step, proactive monitoring and a learning culture with no blame.
High level
This level groups teams that have already invested in automation, without removing all remaining manual brakes (approvals, partly automated tests). It is often the most reachable step for a team leaving the Medium level.
| Metric | Value (2024 report) |
|---|---|
| Deployment Frequency | Once a day to once a week |
| Lead Time for Changes | Between 1 day and 1 week |
| Change Failure Rate | Around 20 % |
| Time to Restore | Less than one day |
To move from High to Elite, the usual levers are removing the remaining manual approvals, investing in observability (distributed tracing), reducing change size and automating rollbacks.
Medium level
This intermediate level gathers the largest number of respondents in 2024 (35 %). Automation exists but remains partial: long-lived branches and fixed release slots still slow the pace, without plunging the organisation into the manual rituals of the Low level.
| Metric | Value (2024 report) |
|---|---|
| Deployment Frequency | Once a week to once a month |
| Lead Time for Changes | Between 1 week and 1 month |
| Change Failure Rate | Around 10 % |
| Time to Restore | Less than one day |
A notable fact from the 2024 report: the Medium level showed a lower failure rate (about 10 %) than the High level (about 20 %), even though it deploys less often. This switch shows these levels are annual snapshots, not immutable laws.
To move from Medium to High, you automate integration tests, reduce long-lived branches, set up continuous deployment and ephemeral environments.
Low level
This level describes organisations where every deployment is still a dreaded event, often surrounded by manual approvals. Recognising it honestly, rather than denying it, is the first step before any improvement.
| Metric | Value (2024 report) |
|---|---|
| Deployment Frequency | Once a month to once every 6 months |
| Lead Time for Changes | Between 1 and 6 months |
| Change Failure Rate | Around 40 % |
| Time to Restore | Between 1 week and 1 month |
The warning signs are easy to spot: quarterly or yearly "big bang releases", mostly manual tests, widespread fear of deployments and incidents lasting weeks.
The 2025 turning point: seven team profiles replace the 4 levels
With the DORA 2025 report, the programme renamed its annual report "State of AI-assisted Software Development" and dropped the Elite/High/Medium/Low model in favour of seven team profiles, built from eight measures combining throughput, stability, product performance, individual effectiveness, time spent on valuable work, friction and burnout risk.
This change is not cosmetic. The 2025 research finds that generative AI amplifies existing dynamics rather than correcting them: a solid team progresses even faster with AI, a fragile team sees its problems worsen. The profiles carry telling names such as "Legacy Bottleneck" (held back by technical debt) or "Harmonious High-Achievers" (performance and well-being aligned).
For a reader discovering the subject, the 4-level model remains the best first reading grid: it is simple, widely documented and still used by most measurement tools. Just keep in mind that the latest DORA report no longer publishes these categories.
How do you collect DORA metrics?
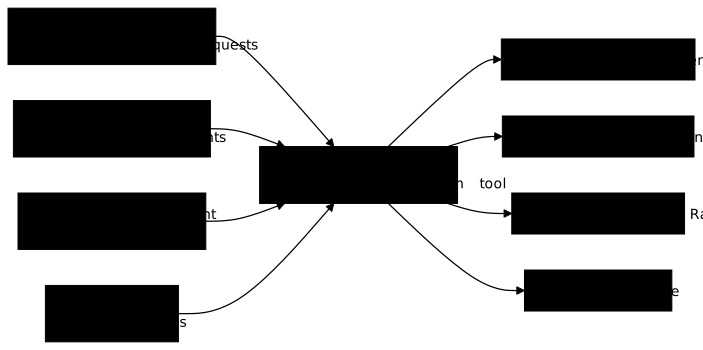
Collecting DORA metrics aggregates several sources: the delivery pipeline alone is not enough, you must cross-reference incidents and monitoring to get reliable figures. The diagram shows where each piece of data comes from and where it is consolidated.
Data sources per metric
Each metric feeds on a different combination of tools. Identifying these sources before choosing a measurement tool avoids discovering, once the project has started, that an essential piece of data simply cannot be exported.
| Metric | Main sources | Data to extract |
|---|---|---|
| Deployment Frequency | CI/CD (GitLab CI, GitHub Actions, Jenkins) | Timestamp of successful deployments |
| Lead Time | Git + CI/CD | Commit timestamp, then deployment timestamp |
| Change Failure Rate | CI/CD + incident management | Correlated deployments and incidents |
| Time to Restore | Incident management + monitoring | Incident opening, then resolution |
Which tools measure DORA?
No need to build your own measurement system: the market offers built-in solutions in your Git or CI/CD platform, and self-hosted open source solutions. The choice depends mostly on your budget and your tolerance for self-hosting.
On the built-in side, GitLab provides ready-to-use DORA dashboards in its Ultimate tier. GitHub does not display the four metrics natively: you get them through a third-party tool or DevLake's GitHub connector. Engineering intelligence platforms such as Sleuth or Harness Software Engineering Insights (formerly Propelo) compute them from several sources.
On the open source side, Apache DevLake collects data from many tools and provides a built-in DORA dashboard: it is the current self-hosted reference. Four Keys, the project originally backed by Google, was archived in January 2024 and is no longer maintained: do not pick it for a new project.
How do you improve your DORA metrics?
Improvement follows a short cycle focused on a single bottleneck at a time: measure, identify, set a goal, act, check, then move to the next bottleneck. The diagram shows the loop, the steps detail what each one requires.

-
Set a baseline (weeks 1-2)
Before any improvement, measure your current state: number of deployments this month, median time from commit to production, number of rollbacks and fixes, average resolution time of P1/P2 incidents. An honest estimate is enough to start.
-
Identify the bottleneck (week 3)
Analyse which metric weighs most on your delivery capacity:
Symptom Metric to prioritise "We are afraid to deploy" CFR (Change Failure Rate) "Features take months to ship" LT (Lead Time) "We rarely deploy and it is always an event" DF (Deployment Frequency) "Incidents last for days" MTTR (Time to Restore) -
Define a SMART goal (week 3)
Example of a well-written goal: "Reduce lead time from 2 weeks to 3 days by the end of the quarter, measured as the median commit-to-production time on our 3 main services."
-
Implement targeted improvements (weeks 4-12)
Focus on the identified bottleneck:
Metric High-impact actions DF Automate tests, reduce manual approvals LT Limit change size, parallelise CI tests CFR Add regression tests, deploy as canary MTTR Write runbooks, improve monitoring -
Measure and adjust (continuously)
Weekly review during the improvement period: are we progressing toward the goal? Are the other metrics regressing? Which unexpected blockers appeared?
-
Move to the next bottleneck
Once the goal is reached, start the cycle again with the next priority metric.
Concrete improvement scenarios
These three scenarios cover frequent situations: they show how the DORA diagnosis leads to a different action depending on the real blocking point, rather than a generic recipe applied blindly.
Scenario 1: frequent but unstable deployments
Context
A SaaS startup deploys 10 times a day but with a CFR of 40 %. Teams spend more time putting out fires than building new features.
The diagnosis is clear: speed is there, but quality does not follow. The action plan below starts from the real incidents rather than from a list of good practices.
-
Root cause analysis
Reviewing the last 10 incidents shows: 6 caused by untested cases, 3 by data incompatibilities, 1 by a configuration error.
-
Immediate actions
Add tests for the missing cases identified. Make data migrations reversible. Validate configurations in CI.
-
Structural actions
Protect risky changes with feature flags. Deploy as canary (1 %, then 10 %, then 100 %). Automate a pre-deployment checklist.
-
Goal set
Bring the CFR from 40 % down to 15 % in 3 months, without reducing deployment frequency.
Scenario 2: large company with no baseline
Context
A financial services company with 200 developers has no measurement of its DORA metrics. The CIO wants to "do DevOps" but does not know where to start.
The diagnosis fits in one sentence: you cannot improve what you do not measure. The first step is therefore not a tool, it is a baseline, even a rough one.
-
Systems inventory
Map the existing tools: Git (GitHub Enterprise), CI/CD (legacy Jenkins and GitHub Actions for new projects), incidents (ServiceNow), monitoring (Datadog).
-
Initial manual measurement
For the 5 critical applications, record by hand the number of deployments, the commit-to-production time and the incidents of the last quarter. Typical result: DF of 2 a month, LT of 3 weeks, CFR of 25 %, MTTR of 4 days.
-
First quick win: automate the measurement
Add a webhook that records each deployment in a central database.
-
Choose a pilot
Select a single motivated team to improve its metrics. A visible success makes adoption easier for the others.
Scenario 3: speed versus quality conflict
Context
Developers want to deploy more often. The QA team blocks, citing insufficient tests. Management does not know who is right.
The diagnosis: it is a false dilemma. DORA says it plainly, "speed and stability are not tradeoffs": in the data, throughput and stability move together instead of opposing each other. An honest caveat to keep in mind against a sceptic: the survey is self-reported and establishes a correlation, not proven causation. The argument still holds, because DORA also finds that industry does not predict performance: high-performing teams exist everywhere, including in regulated sectors.
-
Present the data
Show the DORA 2024 report figures: Elite teams deploy 182 times more often than Low teams, with a CFR 8 times lower and recovery more than 2,000 times faster.
-
Controlled experiment
Propose a 6-week pilot on a non-critical service: automated daily deployment, CFR and MTTR measured continuously, immediate rollback if the CFR exceeds 20 %.
-
Data-driven iteration
If the CFR increases, add tests targeting the failure cases. If it stays stable, extend the approach gradually.
-
Resolving the conflict
Metrics replace opinions. The "speed or quality" debate becomes "how do we improve both".
Common traps and how to avoid them
Measuring without judgement does as much damage as not measuring at all. The following traps come back in teams that adopt DORA without preparation; spotting them saves months of counter-productive measurement.
| Trap | Symptom | Solution |
|---|---|---|
| Gamification | Teams "cheating" to improve the figures | Measure to learn, not to punish. No bonus tied to the metrics. |
| Mean versus median | A 30-day deployment hidden by 29 one-day deployments | Use the median and percentiles (P90, P95) |
| Measurement silos | Each team measures differently | Define a shared glossary |
| Ignoring context | Comparing a startup with a bank | Compare yourself with yourself first |
| Measuring everything | Analysis paralysis | Start with an approximation, refine later |
| Ignored outliers | Major incidents excluded from the statistics | Analyse them separately, without erasing them |
Beyond the 4 metrics: how has the model evolved?
The original 4 metrics have their own history, and knowing it explains why terminology varies from one source to another. The DORA model has never been frozen: it has grown step by step, across successive reports.
In 2018, DORA added a notion of availability to cover operational health beyond delivery alone. In 2021, this notion was broadened and renamed Reliability, to also cover latency, performance and scalability.
Unlike the delivery metrics, Reliability does not rest on a single formula: DORA defines it as whether a team meets its own reliability goals, that is its SLOs (Service Level Objectives, the availability and performance targets it sets itself). A team that aims for 99.9 % availability and holds that threshold consumes little of its error budget (the tolerated failure margin before freezing new features).
In 2023, the MTTR was redefined as Failed Deployment Recovery Time. Then in 2024, DORA added a fifth indicator, the Deployment Rework Rate: the share of deployments that urgently fix a defect already in production. The current model thus groups its 5 metrics into two families: Throughput (change lead time, deployment frequency, failed deployment recovery time) and Instability (change fail rate, deployment rework rate).
DORA implementation checklist
The improvement cycle targets a single bottleneck at a time. This checklist covers rolling out the approach across a team, from day one to quarterly institutionalisation: one sets the improvement pace, the other the rollout calendar.
-
Week 1: baseline
Estimate the current 4 metrics, even roughly. Identify the available data sources. Choose a pilot team.
-
Weeks 2-4: instrumentation
Automate the collection of DF (deployments) and LT (commits and deployments). Link incidents to deployments (CFR). Measure resolution times (MTTR).
-
Month 2: first improvement cycle
Identify the main bottleneck. Define a SMART goal. Carry out 2 or 3 targeted improvements. Measure the impact every week.
-
Quarter 1: institutionalisation
Create a dashboard visible to everyone. Set up a monthly metrics review. Document the lessons learned. Extend to the other teams.
-
Continuously: improvement culture
No blame, focus on the system. Celebrate progress rather than absolute figures. Share successes and failures alike.
Key points
- DORA metrics measure delivery performance on 4 historical axes: deployment frequency, lead time, failure rate and restore time.
- They break a false intuition: speed and stability go together. Elite teams deploy more often and fail less.
- Since 2025, the DORA report has replaced the Elite/High/Medium/Low model with 7 team profiles; the 4-level model remains the best teaching entry point.
- The current model counts 5 metrics, including the Deployment Rework Rate added in 2024, grouped into throughput and instability.
- Never use them to compare or rate teams: they are for learning, not punishing.
- Start with an approximate baseline, tackle a single bottleneck at a time, then iterate.
- Collection aggregates CI/CD, incident management and monitoring; Apache DevLake is the open source reference, Four Keys having been archived since 2024.
- Do not confuse these metrics with the European DORA regulation: same acronym, different subjects.
Knowledge check
Check that you have the essentials of this guide. The questions only cover what has just been explained here.
Knowledge check
Check what you have learned with this interactive quiz
How it works
- The timer starts when you click Start
- Multiple choice, true/false and short answer questions
- You can move between questions
- Detailed results are shown at the end
Starts the quiz and the timer
Review
(0/0)Score by domain
A domain groups several guides and gets several questions, so its score is more reliable than a per-topic score, which often rests on a single question.
Summary
Strengths
No topic passed at 80% on at least two questions yet.
Weak areas
No topic below the pass mark.
Recommended next
Hints before you try again?
Continue the course: DevSecOps security KPIs: measuring your security posture
Continue the course: OWASP Top 10 CI/CD: the 10 security risks of pipelines
A new full quiz with random questions
Work again only on the questions you missed
FAQ: frequently asked questions
The questions below cover the most frequent doubts about DORA metrics: their definition, the Elite level, collection and the confusion with the European regulation of the same name.
- Deployment Frequency (DF): how often you deploy to production.
- Lead Time for Changes (LT): time between commit and deployment.
- Change Failure Rate (CFR): percentage of deployments causing an incident.
- Time to Restore Service (MTTR): time to restore the service, renamed Failed Deployment Recovery Time in 2023.
| Metric | Elite value |
|---|---|
| Deployment Frequency | On demand, several times a day |
| Lead Time | Less than one day |
| Change Failure Rate | Around 5 % |
| Time to Restore | Less than one hour |
- Built-in solutions: GitLab's DORA dashboards (Ultimate tier), or platforms such as Sleuth and Harness Software Engineering Insights (formerly Propelo). GitHub does not display the four metrics natively.
- Open source: Apache DevLake, the current self-hosted reference.
- DORA metrics (DevOps Research and Assessment): the delivery performance indicators described on this page.
- DORA regulation (Digital Operational Resilience Act): a European regulation on the operational resilience of the financial sector (cybersecurity, IT risk management).