After the installation, the Proxmox web interface can look intimidating: dozens of menus, new terms (Datacenter, Node, Guest...), and no obvious place to start. This guide gives you the keys to find your way around.
What you will learn
By the end of this page, you will know:
- where to configure what, thanks to the 3-level rule (Datacenter → Node → VM/CT);
- how to perform the essential actions: create a VM, open a console, read an error log, delete a VM;
- how to diagnose a problem: why a button is grayed out, why a task fails, and how to read its result through the API.
The 3-level rule: where do you configure what?
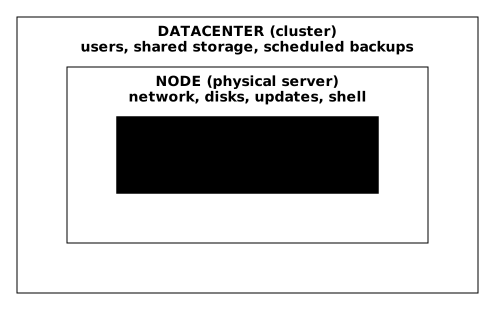
This is the one thing to understand so you never get lost in Proxmox. The interface is organized in 3 hierarchical levels, and each level has its own responsibility.
What the hierarchy really covers
This hierarchy is not a display convention, it matches the place where Proxmox
actually writes the configuration. What you set at the Datacenter level is
stored in the /etc/pve file system, automatically replicated to all the nodes
of the cluster. What you set at the Node level touches files specific to the
server (/etc/network/interfaces, the APT repositories, the physical disks)
and never leaves that machine. What you set at the Guest level lands in one
configuration file per machine, such as /etc/pve/qemu-server/100.conf for a
VM.
In practice, this gives you a reliable decision rule: if the setting must survive moving a VM to another node, it belongs to the Datacenter level or to the Guest level. If it describes the hardware or the operating system of the hypervisor, it belongs to the Node level.
The 3 golden rules
These three rules cover almost every navigation doubt. Reading them once is not enough; what anchors them is asking yourself "who is affected by this setting?" before each click, during the first weeks.
Rule 1: the cluster is configured at the Datacenter
Everything that must apply to all the servers is configured at the
Datacenter level. These settings live in /etc/pve, which the cluster replicates
to all the nodes, as it does for the configuration of each VM: what sets the
Datacenter apart is not replication, it is its scope.
- Create a user? → Datacenter → Permissions
- Add a shared NFS storage? → Datacenter → Storage
- Schedule automatic backups? → Datacenter → Backup
- Configure the SSL certificate? → Datacenter → ACME
Rule 2: the hypervisor's OS is maintained at the Node
Everything that concerns the physical server is configured at the Node level. These settings do not propagate: on a cluster, you have to replay them node by node, which is a classic source of mistakes when adding a server.
- Update Proxmox? → Node → Updates
- Configure the network (bridge, VLAN)? → Node → System → Network
- See the physical disks? → Node → Disks
- Reach the root shell? → Node → Shell
Rule 3: the workload is configured at the Guest
Everything that concerns a VM or a container is configured at the Guest level. These settings follow the machine during a migration, since they live in its configuration file and not on the node.
- Add RAM? → VM → Hardware
- Change the boot options? → VM → Options
- Create a snapshot? → VM → Snapshots
- Open a console? → VM → Console
In practice: where to go to...
Rather than an exhaustive table, here are ten common actions and where to do them:
| I want to... | Level | Path |
|---|---|---|
| Create a VM | Header | Create VM button (at the top) |
| Create a container | Header | Create CT button (at the top) |
| Add a user | Datacenter | Permissions → Users → Add |
| Set up an automatic backup | Datacenter | Backup → Add |
| Update Proxmox | Node | Updates → Refresh → Upgrade |
| Configure the network | Node | System → Network |
| Add RAM to a VM | VM | Hardware → Memory → Edit |
| Open a console | VM/CT | Console button or Console menu |
| See why it failed | Anywhere | Double-click the task at the bottom |
| Change my password | Header | User menu (your name) → Password |
Choose your path
Depending on what you want to do now, follow the matching path:
I want to create my first VM
Guided path to create a VM and understand the UI along the way
I want to understand errors
Where to look when "it does not work"
I want to access a console
noVNC, SPICE, xterm.js: which one to use?
I want to organize my machines
Tags, pools, naming conventions
Walkthrough: create a VM and discover the UI
This path has you create a VM while showing you the key elements of the interface. Even if you do not have an ISO yet, follow the steps to understand how it works.
-
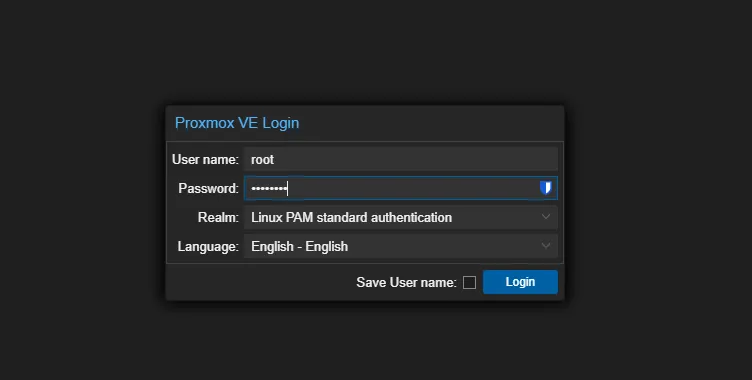
Log in to the interface
Open
https://your-ip:8006in your browser. You land on the login screen.- User name:
root(or the user you created) - Password: your password
- Realm:
Linux PAMfor root, orProxmox VE authenticationfor Proxmox users
- User name:
-
Locate the 4 zones of the interface
Once logged in, you see:
- At the top: the action bar with the Create VM and Create CT buttons, and your user name
- On the left: the resource tree (Datacenter → your node → your VMs)
- In the center: the content panel that shows the details of the selected item
- At the bottom: the task panel (very important for debugging!)
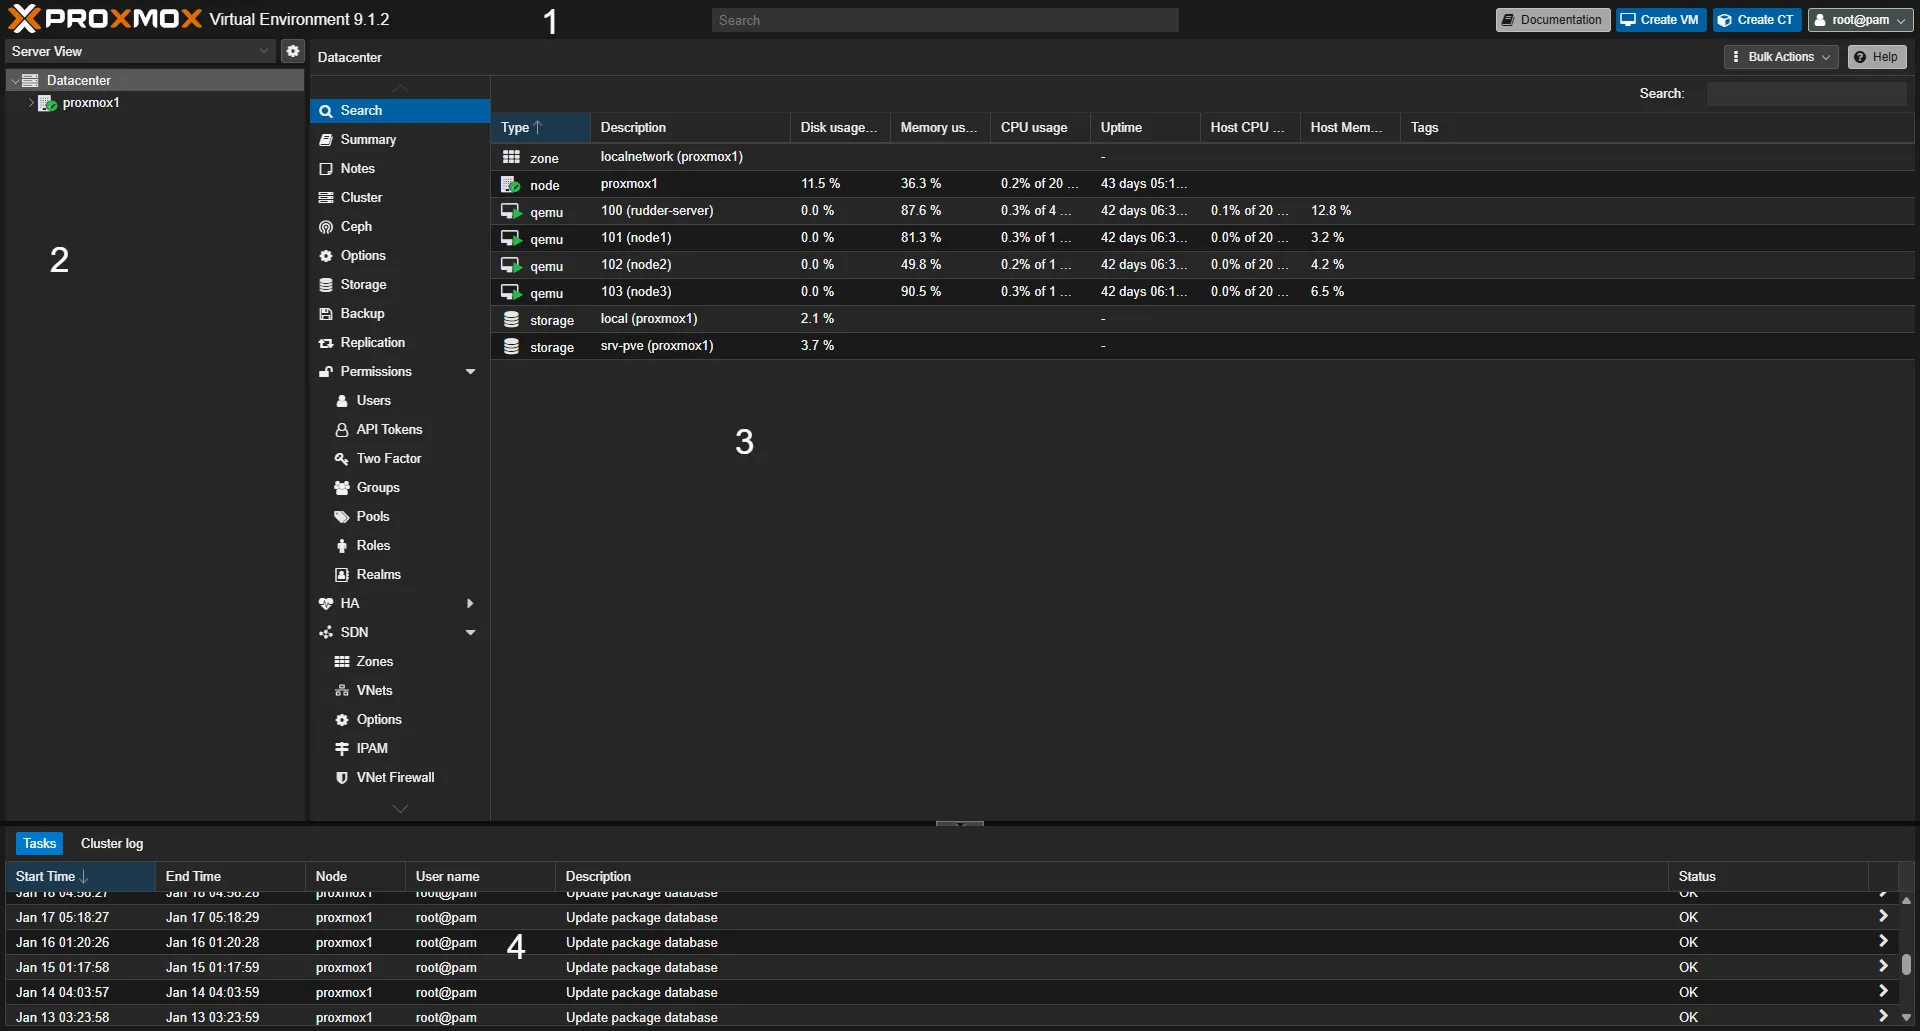
The tree on the left drives everything else: the central panel only ever shows the properties of the currently selected item. A menu you cannot find almost always comes from a selection at the wrong level.
-
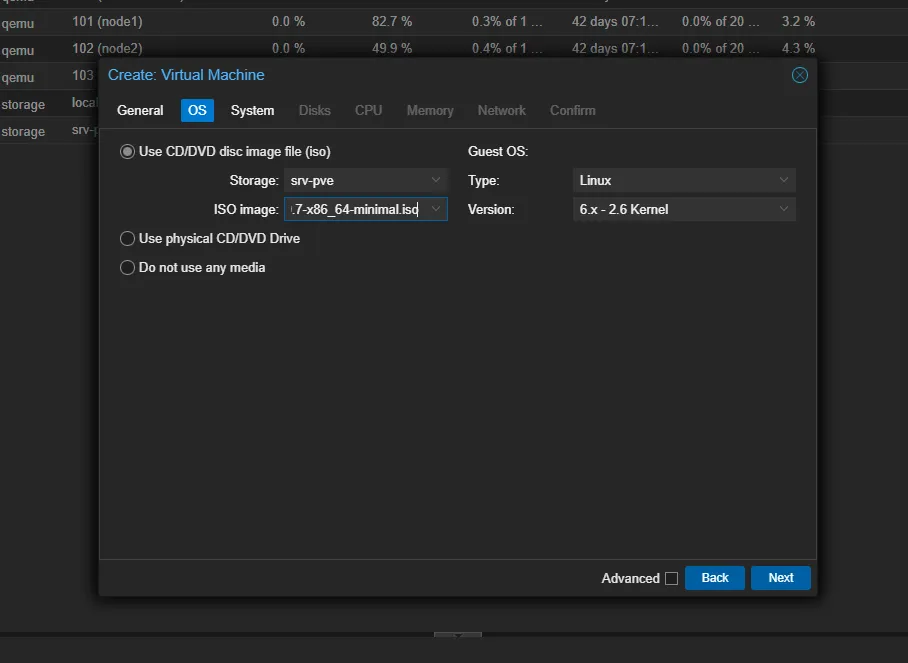
Click "Create VM" (at the top right)
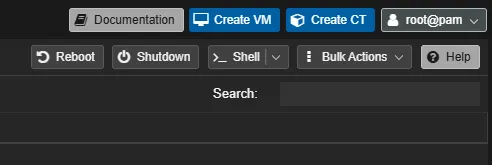
A wizard opens with several tabs. Do not worry about filling everything in perfectly, the goal here is to understand the flow.
The wizard asks you for:
- General: the VM name, on which node to create it
- OS: which ISO to use (you must download one first)
- System: machine type, BIOS (leave the defaults at first)
- Disks: size of the virtual disk, on which storage
- CPU: number of cores
- Memory: amount of RAM
- Network: virtual network card
- Confirm: summary before creation
-
Watch the creation task
When you click Finish, look at the bottom of the screen: a line appears in the task panel. It is the creation of your VM in progress.
- Status "running": the task is in progress
- Status "OK": finished successfully
- Status "ERROR": a problem occurred, double-click to see the logs
This area is crucial to understand what is happening. Get into the habit of looking at it after every action.

-
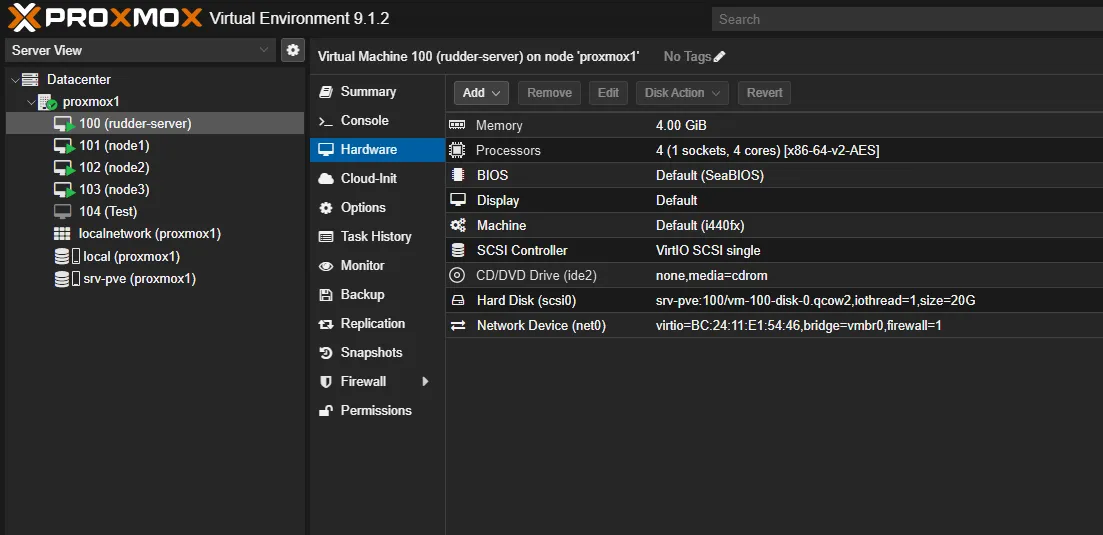
Find your VM in the tree
After creation, your VM appears under your node in the tree on the left. Click on it.
The central panel now shows the options of the VM:
- Summary: current state (stopped, CPU, RAM...)
- Console: to see the VM's screen
- Hardware: to change CPU, RAM, disks
- Options: for the boot order, the QEMU agent...
-
Start the VM and open the console
At the top of the central panel, you see action buttons:
- Start: start the VM
- Shutdown: clean shutdown, the guest OS is notified and closes its services
- Stop: forced shutdown, the QEMU process is killed without warning the guest, with the risk of corruption that implies
- Console: open the VM's screen
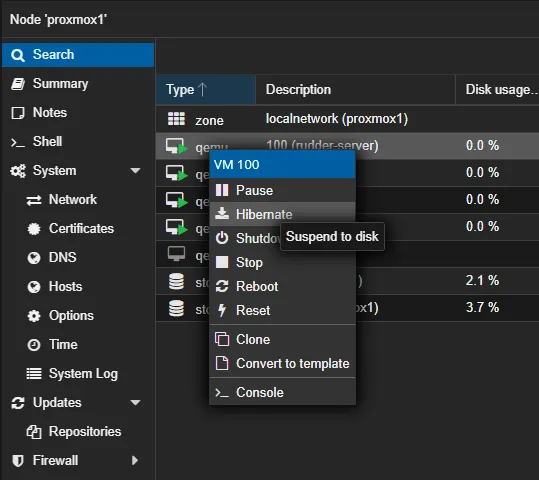
Click Start, then Console. You see the boot screen of your VM (or a black screen if there is no ISO).
Walkthrough: diagnose a problem
"I clicked, but nothing happens." This is a very common frustration among beginners. Here is how to investigate.
Step 1: Look at the task panel
The panel at the bottom of the screen shows all the operations in progress or recent. It is your first source of information.
When you perform an action (create a VM, start, back up...), a line appears with:
- The start time
- The type of operation
- The node concerned
- The status:
running(in progress),OK(success),WARNINGS,ERROR
If you see ERROR, this is where you will find the cause of the problem.
Step 2: Double-click to see the logs
When a task fails, double-click it. A window opens with the full log of the operation.
Scroll to the bottom: the error is usually in the last lines. Look for words like:
error,failed,deniedpermission denied→ permissions problemno space left→ storage fulltimeout→ network or service that does not answer
Step 3: five common errors
Instead of a table, here are five situations you will often meet:
"The Create VM button is grayed out"
You do not have the permission to create VMs. Two possibilities:
- You are not logged in as
root@pam - The role assigned to your user does not contain the
VM.Allocateprivilege (the built-inPVEVMAdminrole carries it, for example)
To fix it, log in as root, or go to Datacenter → Permissions → Add to grant the rights.
"The Migrate button is missing or grayed out"
Migration moves a VM to another node of the cluster, so you need at least two nodes. Shared storage is not mandatory, but it saves copying the disks from one node to the other.
With a single server, the interface does not show the button, and that is normal: there is nowhere to migrate to. In a cluster, the button is grayed out when your account does not have the VM.Migrate permission on the VM.
"The console shows a black screen"
Several possible causes:
- The VM is not started → click Start
- The VM boots but there is no display → check the boot order (Options → Boot Order)
- The VM is waiting for an ISO that is not mounted
Check the status shown in the tree (small green triangle on the icon = running, fully grayed-out icon = stopped) and the boot order.
"The task shows ERROR"
Double-click the task to read the log. Among the common causes:
- Storage full
- Permission denied
- ISO not found
- Misconfigured network
Read the exact error message in the log.
"The interface no longer responds / timeout"
The pveproxy service may be down. Connect over SSH and restart it:
systemctl restart pveproxyIf that is not enough, check that port 8006 is not blocked by a firewall.
Where to find the full history
The task panel at the bottom only shows recent tasks. To see the whole history:
-
Click your node in the tree
-
Go to Task History
-
You see all the past tasks, with their status
-
Double-click any of them to see its log
This is very useful to understand what happened yesterday, or to debug a backup that failed during the night.
How do you read a task's result on the command line?
Every long operation (start, shutdown, backup) becomes a task, and Proxmox
gives it a unique identifier, the UPID. This identifier names the node, the
type of task (qmstart for a VM start, qmstop for a shutdown), the VM number
(the VMID) and the user who launched it. It has the following form, here with
example values:
UPID:pve1:000A1B2C:0123ABCD:65F0A1B2:qmstart:100:root@pam:The task panel displays these tasks in the interface. The same information can
be read on the command line, from the node's shell, with pvesh, the tool that
calls the Proxmox API without going through the browser. The reference for the
paths and their parameters is the official
API viewer.
The point to understand is that the API accepts a request before executing it. Starting a VM returns a UPID right away, even if the task will fail afterwards:
pvesh create /nodes/pve1/qemu/100/status/startThis answer only proves that the request went out, not that the VM is running. To know whether the operation succeeded, you have to read the result of the task itself. If you did not keep the UPID, list the VM's tasks by filtering on the wanted type:
pvesh get /nodes/pve1/tasks --vmid 100 --typefilter qmstartEach entry of the list carries the UPID of the task. Then query it to get its status:
pvesh get /nodes/pve1/tasks/UPID:pve1:000A1B2C:0123ABCD:65F0A1B2:qmstart:100:root@pam:/statusTwo fields answer the question. The status field is running while the task
is executing and stopped once it is finished. The exitstatus field then
gives the result: OK if everything went well, WARNINGS: n if the task
ended with n warnings, otherwise the error message. As long as status is
running, exitstatus says nothing useful: wait for the task to finish before
concluding.
One last trap concerns what the journal represents. It tells what happened, it does not say what state the machine is in now: a VM whose start succeeded yesterday may very well be stopped today. To know the current state, query the VM itself:
qm status 100How do you delete a VM without touching its neighbor?
A VM that has become useless is deleted with More → Remove in the interface, or
qm destroy <vmid> on the command line. Both also destroy its disks, with no
way back: re-read the number with qm list before confirming, especially when a
neighboring VM must stay intact.
Walkthrough: access a machine's console
You want to see the "screen" of your VM or your container. Proxmox offers several types of consoles, but in practice, it is simple.
The simple rule
Just remember this:
- VM → use noVNC (it is what the default setting opens for a VM with neither SPICE nor a serial port, and it works in the browser)
- Container → use xterm.js (it is the default, a terminal in the browser)
- SPICE → ignore it for now (it is for advanced cases)
That is all. Proxmox automatically picks the right console by default.
Open a console
The console opens in the central panel, which quickly limits the available
space as soon as the guest displays a graphical installer. Get into the habit
of detaching it into a separate tab: the keyboard is captured correctly there,
which prevents shortcuts like Ctrl+Alt+F2 from being intercepted by the
browser instead of being passed to the machine.
-
Click your VM or container in the tree
-
Click the Console button (at the top) or the Console menu (on the left)
-
The console opens in the central panel
-
For a larger display, click the "open in a new tab" icon (at the top right of the console)
Why does the xterm.js console of a VM stay blank?
xterm.js connects to the serial port of the VM, and a VM does not have one by default: you have to add it (qm set <vmid> --serial0 socket). Without a serial port, the interface falls back to noVNC; with a serial port but a guest system that does not listen on it, the xterm.js screen stays blank. It is the same condition as qm terminal, which otherwise answers "unable to find a serial interface".
The simple solution is to ask for noVNC for VMs. The setting is at the Datacenter level, so it applies to all machines:
- Datacenter → Options
- Double-click Console Viewer
- Choose
HTML5 (noVNC)
The other choices are SPICE (remote-viewer), xterm.js and Default (xterm.js). The latter is the original setting: for a VM, the interface then opens SPICE if it is enabled on the VM, xterm.js if the VM has a serial port, and noVNC otherwise. This is why only a VM with a serial port shows this blank screen.
Copy-paste between your PC and the VM
This is a question that comes up often. By default, copy-paste does not work between your computer and the VM, and wrong advice circulates on the subject: the QEMU agent is not enough, it serves another purpose (clean shutdown, reporting IP addresses, freezing the file system during a backup).
The noVNC clipboard relies on a separate component, the vdagent agent, and on an option of the virtual graphics card. You therefore need both:
-
Enable the
clipboard=vncoption on the VM's display, in VM → Hardware → Display, or on the command line:Terminal window qm set 100 -vga std,clipboard=vnc -
Install the SPICE guest tools in the VM:
Terminal window # On Debian/Ubuntuapt install spice-vdagentsystemctl enable --now spice-vdagent -
Restart the VM
A clipboard button then appears in the sidebar of the noVNC console: it opens a text area where you paste what you want to send to the VM. One last constraint, often forgotten: spice-vdagent needs an active graphical session in the guest. On a server without a desktop environment, this method will not work, use SSH instead.
Do not uninstall the QEMU agent for all that. qemu-guest-agent, enabled through VM → Options → QEMU Guest Agent, lets Proxmox ask the guest system for a clean shutdown, display its IP addresses in the Summary tab, and freeze disk writes for the duration of a consistent snapshot. These are three functions that the clipboard does not cover.
Organize your machines from the start
Even with 2-3 VMs, build good habits. When you have 20, you will be glad you did.
Naming conventions
Give your VMs explicit names. Avoid VM1, VM2, test.
A good format: <function>-<environment>-<number>
Examples:
web-prod-01: production web serverdb-staging-02: staging databasegitlab-dev: development GitLabpfsense-fw: pfSense firewall
You immediately understand what each machine is for.
Use tags
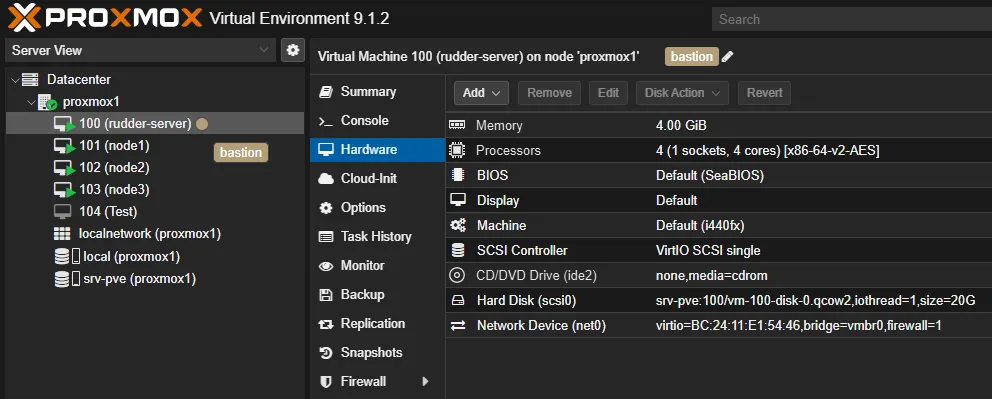
Tags are labels you can add to your VMs and containers. They appear in the tree and allow filtering.
To add a tag:
-
Select a VM or a container
-
In Summary, find the Tags line
-
Click the pencil icon, to the right of the line
-
Type a tag (e.g.
production) and confirm
Useful tags to create:
production,staging,dev, the environmentweb,db,mail,monitoring, the type of servicebackup-daily,backup-weekly, the backup policycritical,low-priority, for high availability
Then use the Tag View (selector at the top of the tree) to see your machines grouped by tags.
Use pools (optional at first)
Pools are groups of resources (VMs, containers, storage). Their main benefit: simplifying permissions.
Instead of granting rights on each VM, you grant rights on a pool, and all the VMs in the pool inherit those rights.
Useful when:
- You have different teams (dev, ops, clients)
- You want to delegate the management of a group of VMs
For now, if you are alone on your Proxmox, you can ignore pools.
Add notes
Every VM, container and node has a Notes field (in Summary). Use it!
Notes support Markdown. Document:
- What this machine is for
- How to reach it (IP, ports)
- Configuration particularities
- The owner's contact
Example of a note for a VM:
## Production web server
- **IP**: 192.168.1.50- **Services**: nginx, php-fpm- **Backup**: daily at 3 am- **Contact**: alice@example.com
### Notes- SSL certificate renewed automatically (certbot)- Do not restart during office hours
The screens to know (and those to ignore)
The Proxmox interface has many menus. At the start, focus on these:
At the Datacenter level: the 6 essentials
These six screens concentrate the settings that apply to the whole infrastructure. The one to open first is not Summary but Storage: it decides where your ISOs and virtual disks go, and if no storage accepts the right type of content, you will be able neither to upload an ISO nor to create a virtual disk.
- Summary: overview of your infrastructure
- Storage: add/manage shared storages
- Backup: schedule automatic backups
- Permissions: manage users and rights
- Options: default console, global settings
- Notifications: receive alerts by email
The other menus (to go deeper)
- Cluster: create or join a multi-node cluster
- Replication: replicate VMs between nodes
- HA: high availability (automatic restart)
- ACME: Let's Encrypt certificates
- Firewall: cluster-level firewall
- Metric Server: send metrics to Grafana/InfluxDB
At the Node level: the 5 essentials
This level is that of classic system administration, with two screens that call for caution. System → Network applies its changes when the network service restarts: a bridge mistake and you lose access to the web interface, which requires physical or IPMI access to recover. Updates must be checked regularly, because a node that is not kept up to date falls behind the other nodes of the cluster, and a migration to a node older than its source is not guaranteed.
- Summary: server state (CPU, RAM, uptime)
- Shell: terminal to administer the server
- System → Network: configure bridges and network
- Updates: update Proxmox
- Disks: see the physical disks
The other menus (to go deeper)
- Ceph: distributed storage (separate installation)
- Firewall: node-level firewall
- Replication: replication jobs
- Task History: task history
- Subscription: license and support
At the VM/CT level: the 5 essentials
The menu changes name depending on the type of machine, Hardware for a VM and Resources for a container, which is confusing at first even though they play the same role. Above all, remember the difference between Snapshots and Backup: a snapshot is a quick return point that stays on the same storage and disappears with it, a backup is a standalone archive that you can restore elsewhere. The two do not replace each other.
- Summary: machine state
- Console: access the screen
- Hardware (VM) / Resources (CT): change CPU, RAM, disks
- Snapshots: create restore points
- Backup: back up the machine
The other menus (to go deeper)
- Options: boot order, QEMU agent, protection
- Firewall: VM firewall
- Replication: replication to another node
- Cloud-Init (VM): automatic configuration
- Monitor (VM): advanced QEMU interface
- Permissions: specific access rights
The tree views
At the top of the tree on the left, a selector lets you change the view. Here is when to use each one:
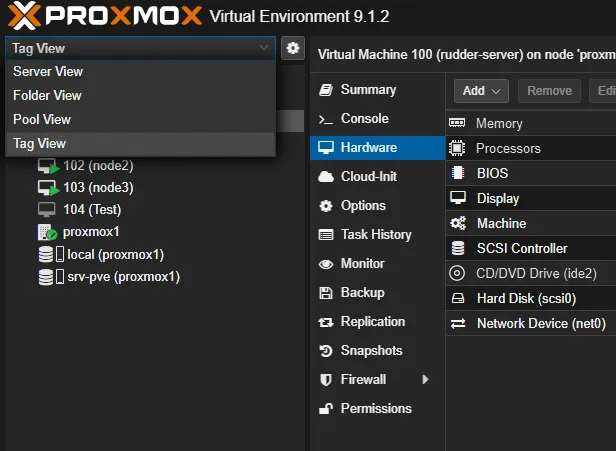
The Server View, the default one, shows the VMs under their node. Use it when you have few machines or when you want to know "what is running on this server".
The Folder View groups by type (all the nodes together, all the VMs together, all the storages together). Handy to see "all my VMs" at once.
The Pool View groups by pool. It is useful if you have organized your resources into pools (projects, clients, environments).
The Tag View groups by tags. It is very handy if you use tags such as production, web, client-xyz.
Stay in Server View at the start, then switch to Tag View when you have more than 10 machines and well-organized tags.
Put it into practice
Three VMs have been handled on the lab node, one of which has lost its disk. You report the UPID and the final result of the starts of VMs 191 and 192, then the current state of the sentinel VM 190, and you delete the temporary VMs without touching the sentinel. Validation compares your report with the UPID registry kept by the lab, with the final status of each task read through the API, with the state of VM 190 and with the digest of its configuration.
Key takeaways
-
The interface is organized in 3 levels, Datacenter (cluster), Node (server) and Guest (VM/CT), and each has its own responsibility.
-
After every action, look at the task panel at the bottom, and double-click to see the logs in case of an error. On the command line, a task's UPID lets you read its final result (
exitstatus), and a VM's current state is read withqm status, not in the journal. -
noVNC serves as the console for VMs and xterm.js for containers: it is the default, no need to touch it, except for a VM with a serial port whose xterm.js console stays blank (Datacenter → Options → Console Viewer →
HTML5 (noVNC)). -
A grayed-out button comes from a missing permission (Create VM) or a missing condition (the Migrate button disappears as long as there is only one node, and is grayed out without the
VM.Migratepermission): check the ACLs in Datacenter → Permissions first, then the cluster configuration. -
Organize your machines from the start with explicit names, tags and notes.